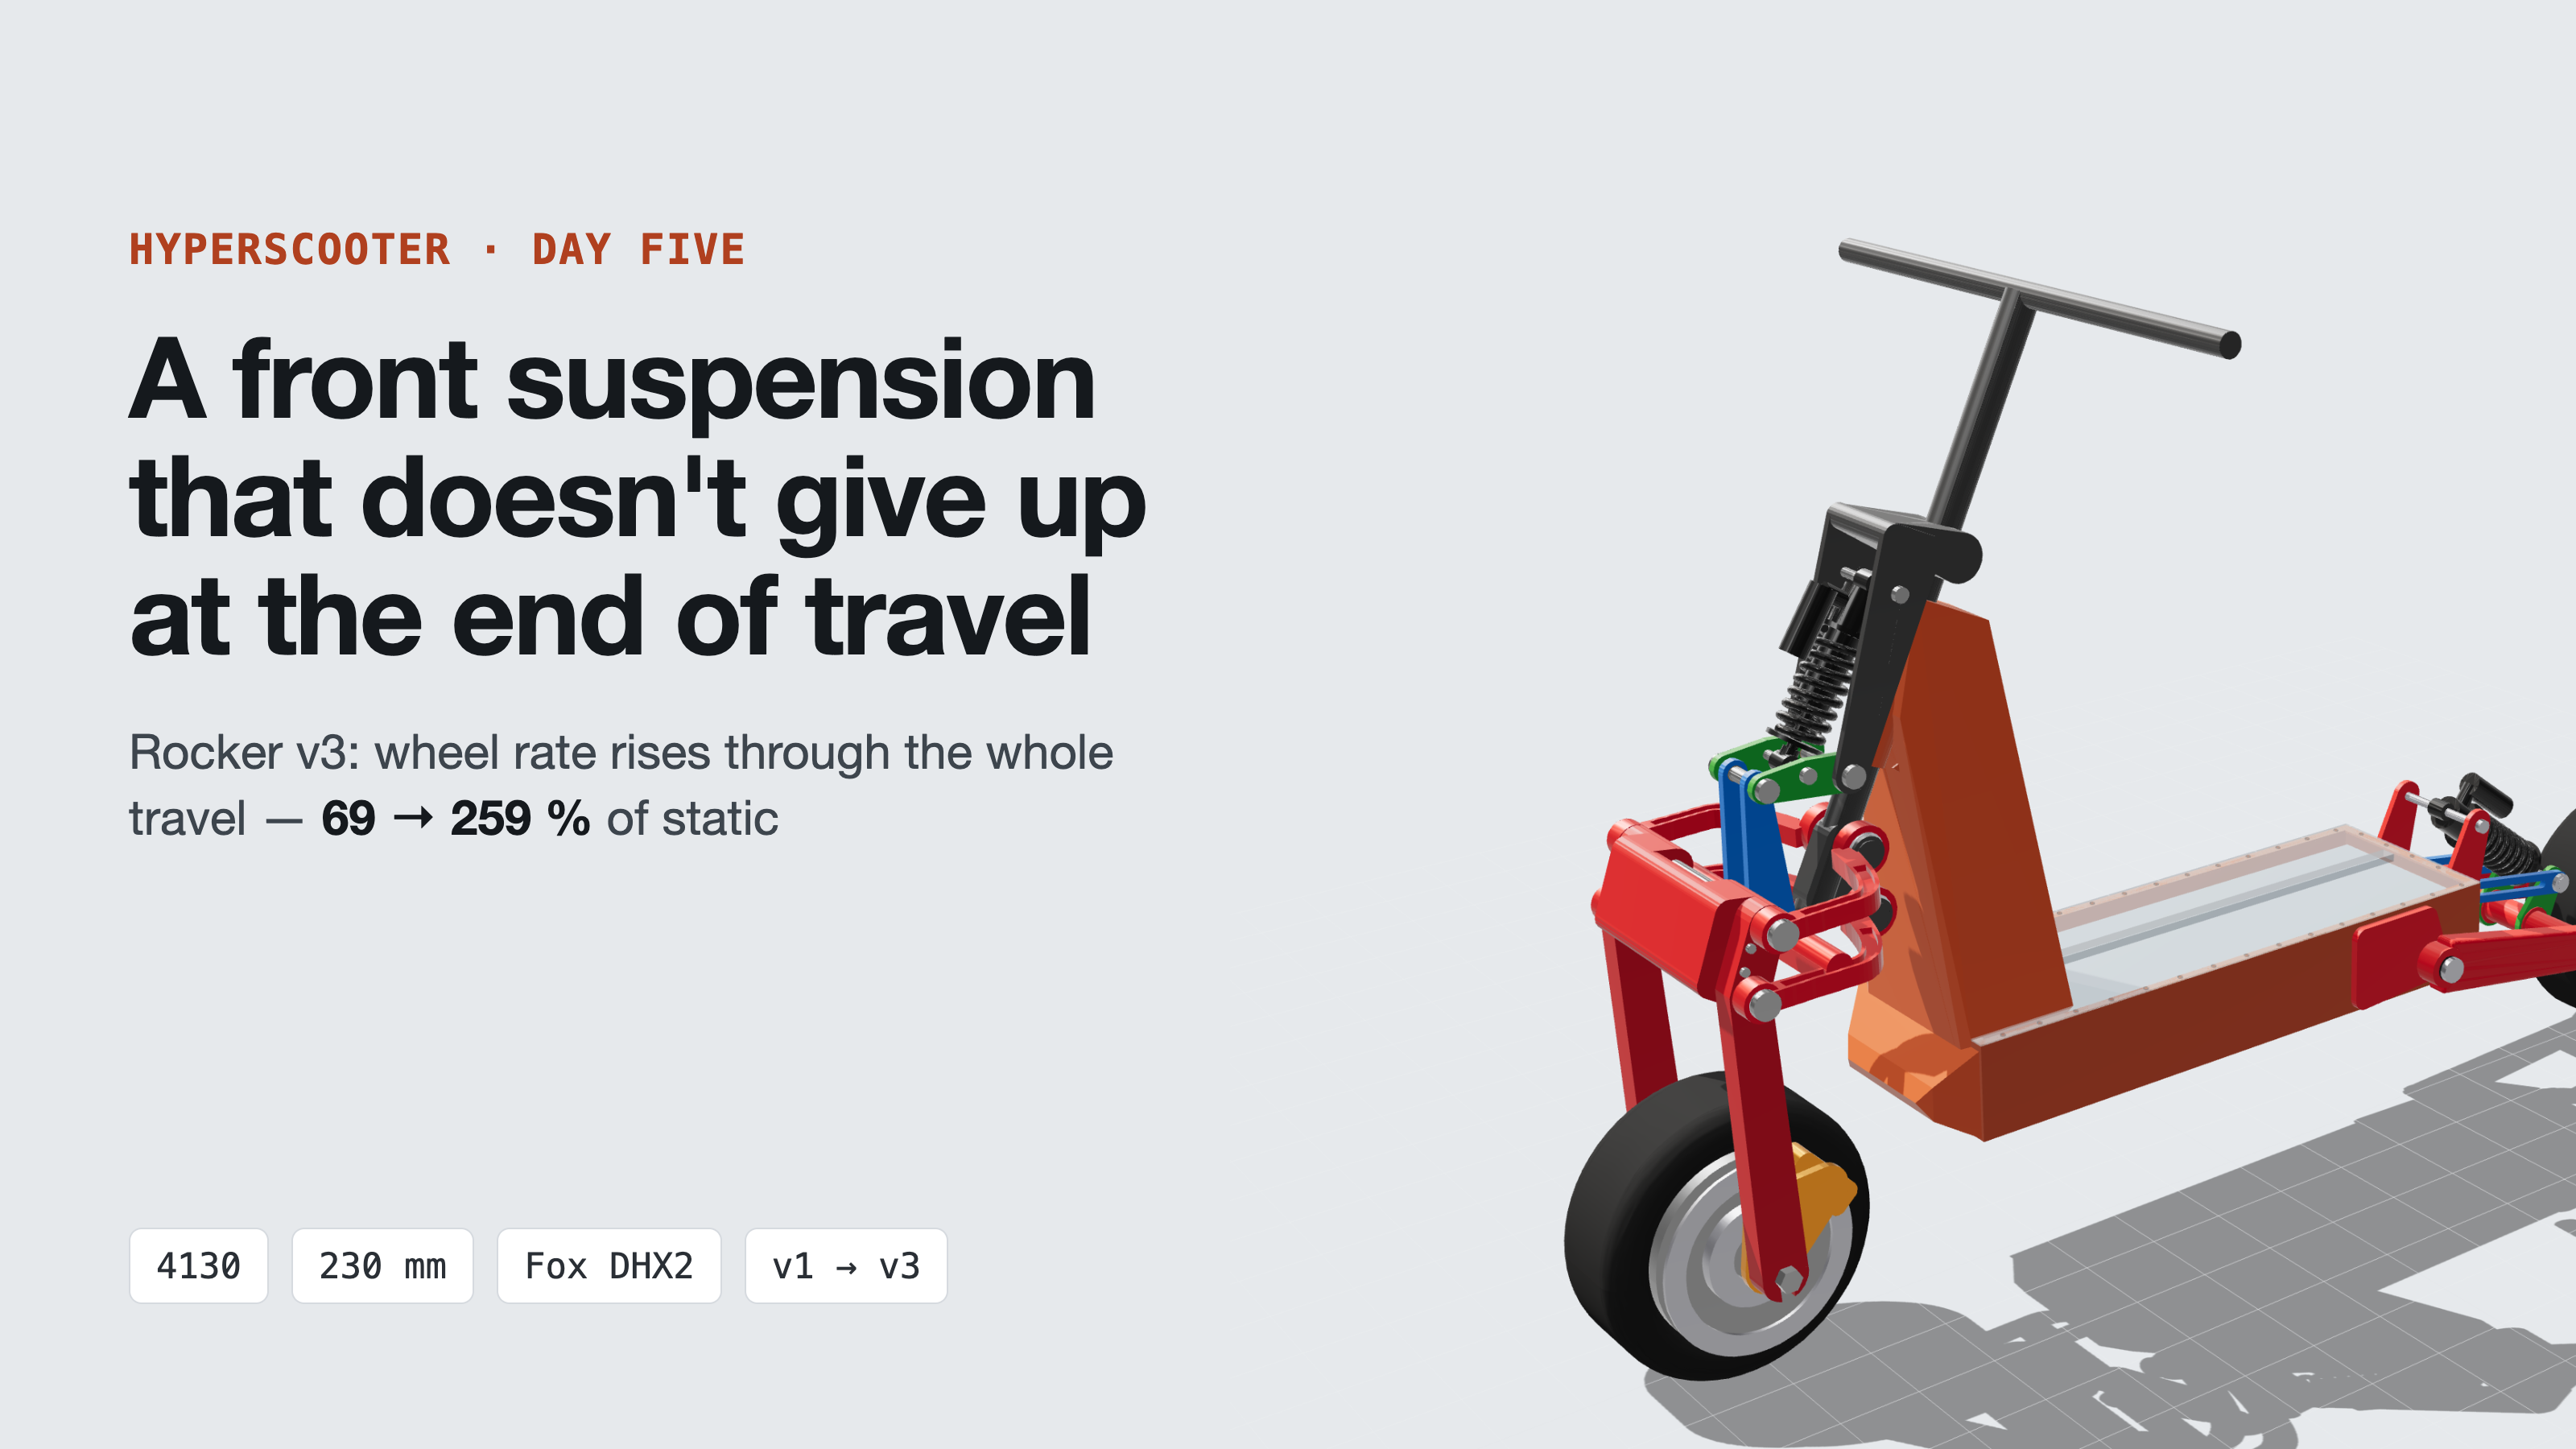
Day five of the Hyperscooter. We haven't written about the scooter itself yet — only about its DC-DC. So first, briefly: what this machine is and how we design it. Then the story of one chart: how a curve on our test rig told us the front suspension gives up at the end of travel, and how five attempts later we arrived at a rocker whose rate keeps rising all the way to the stop.
What the Hyperscooter is
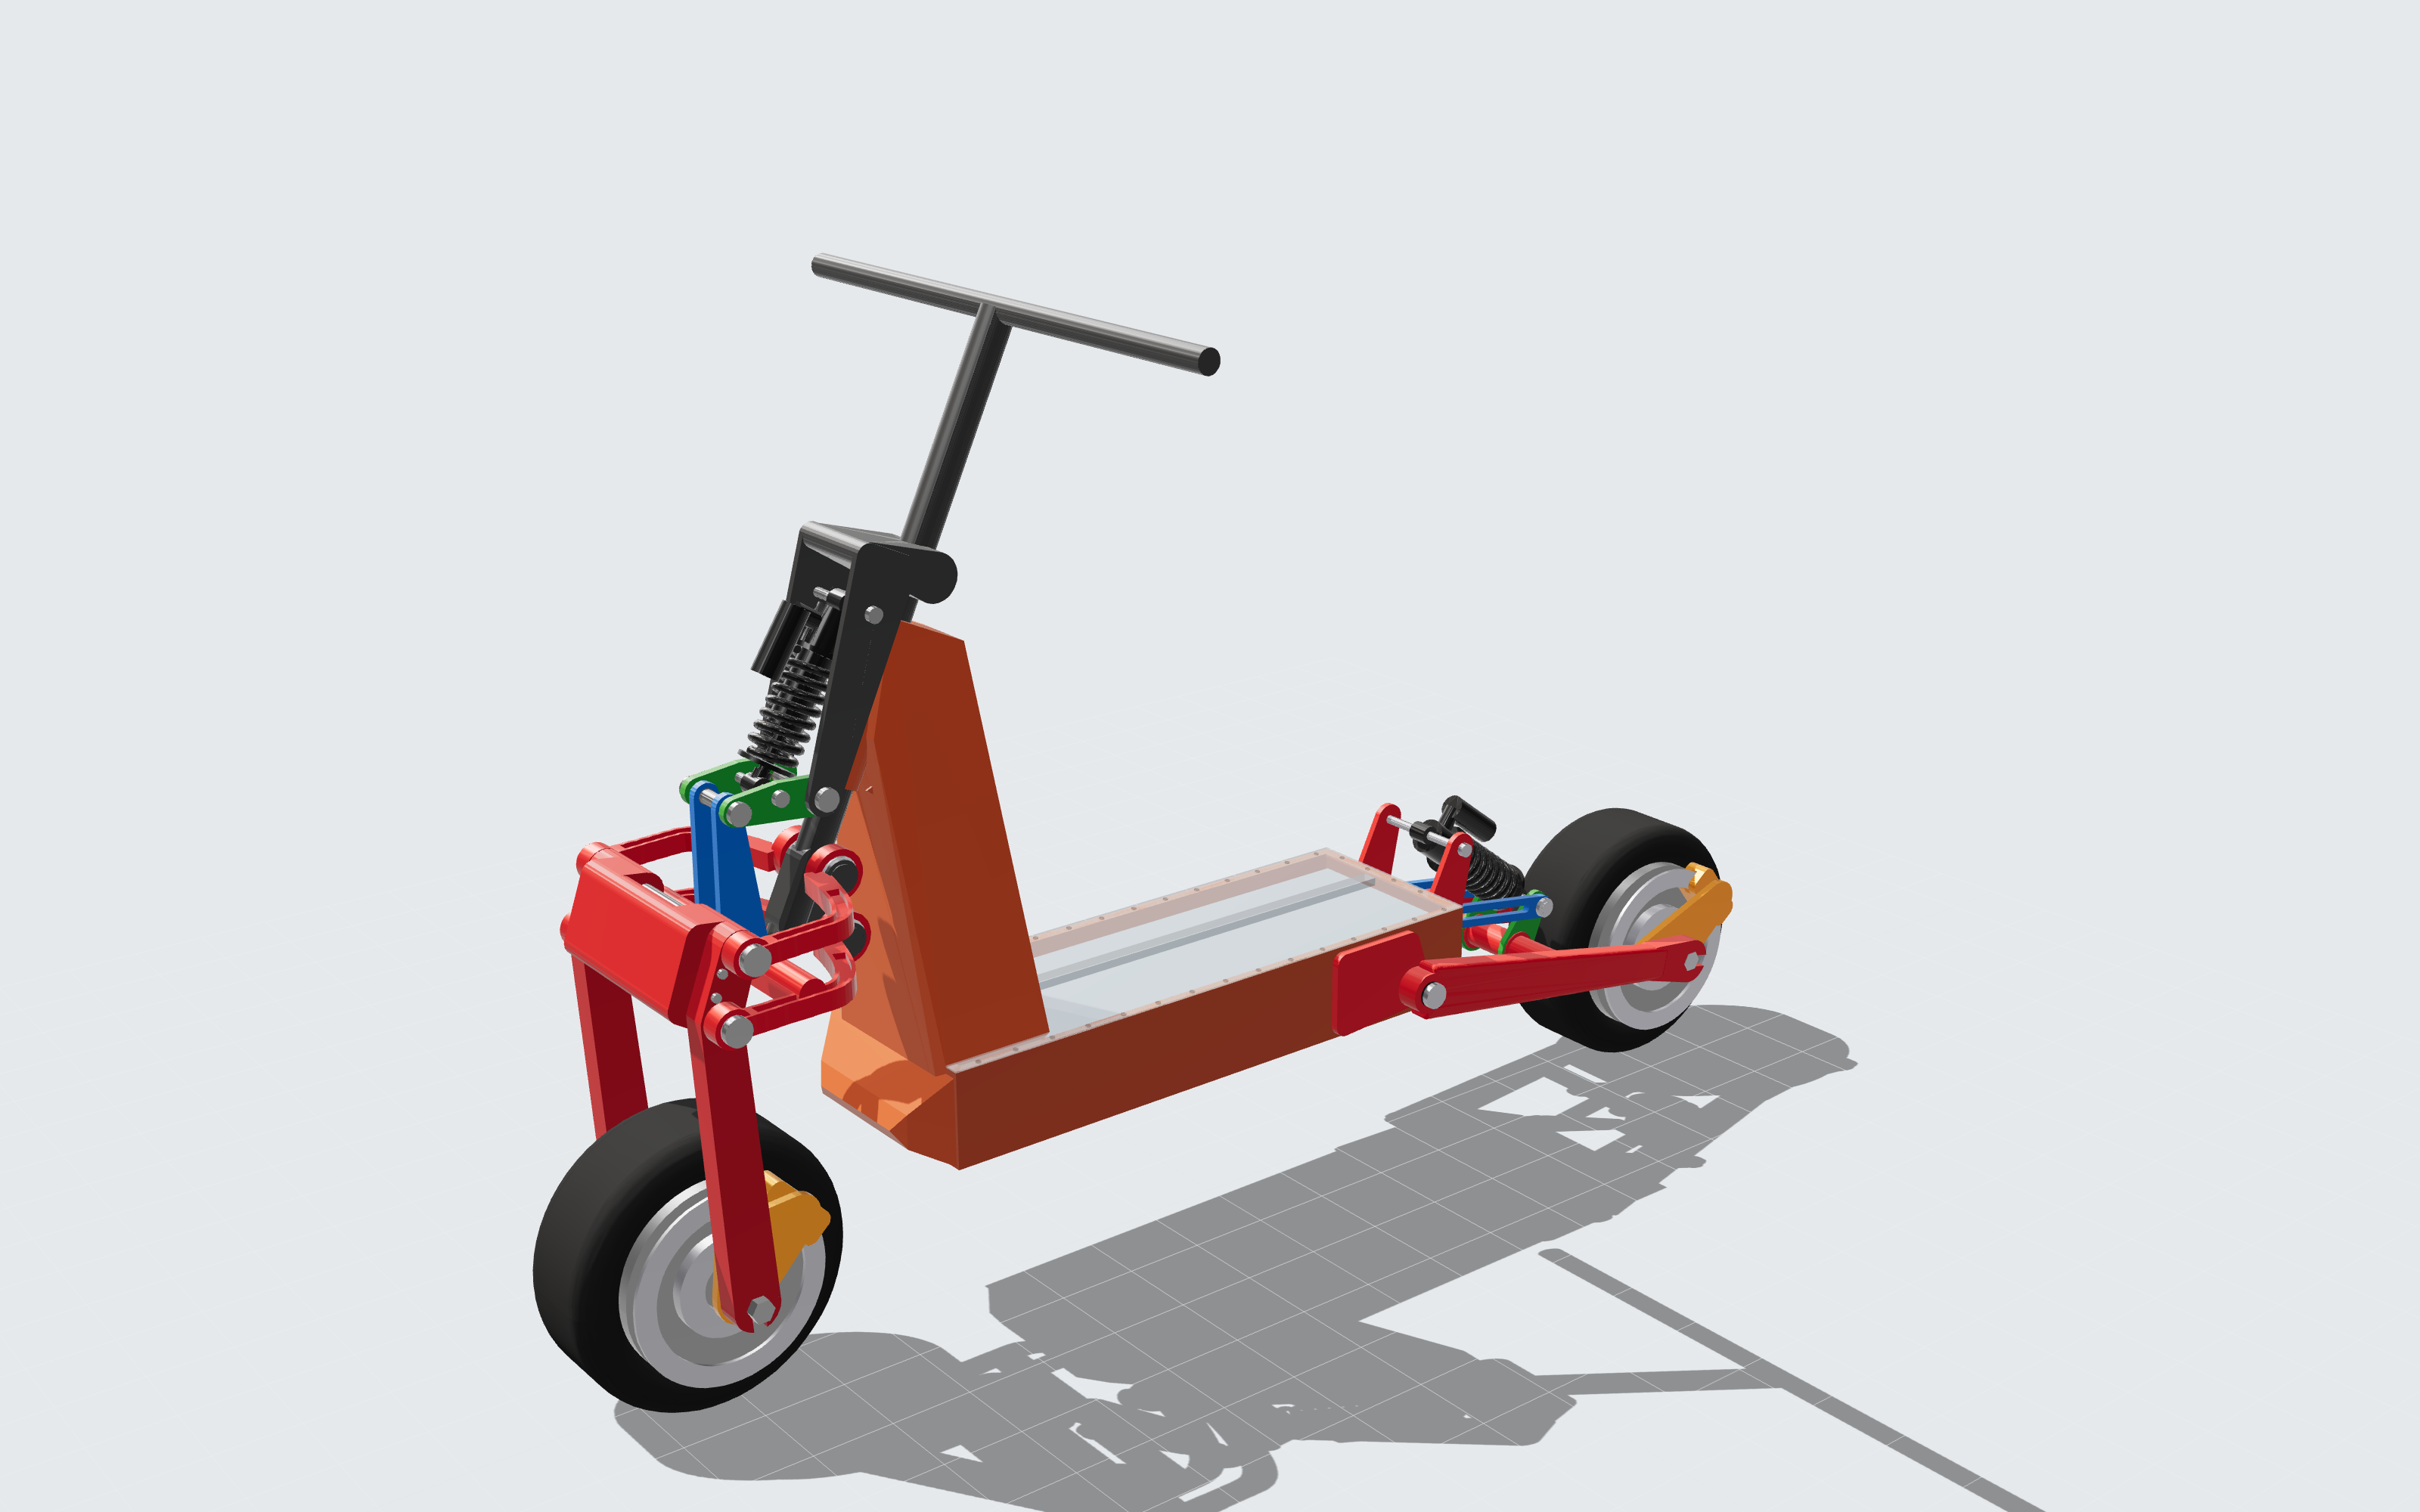
An electric scooter for off-road riding and jumps that we are designing from scratch. There are almost no off-the-shelf assemblies in it: our own frame, our own suspension, our own controllers and electronics.
- Frame — a load-bearing tub of 4130 steel, battery inside on vibration mounts.
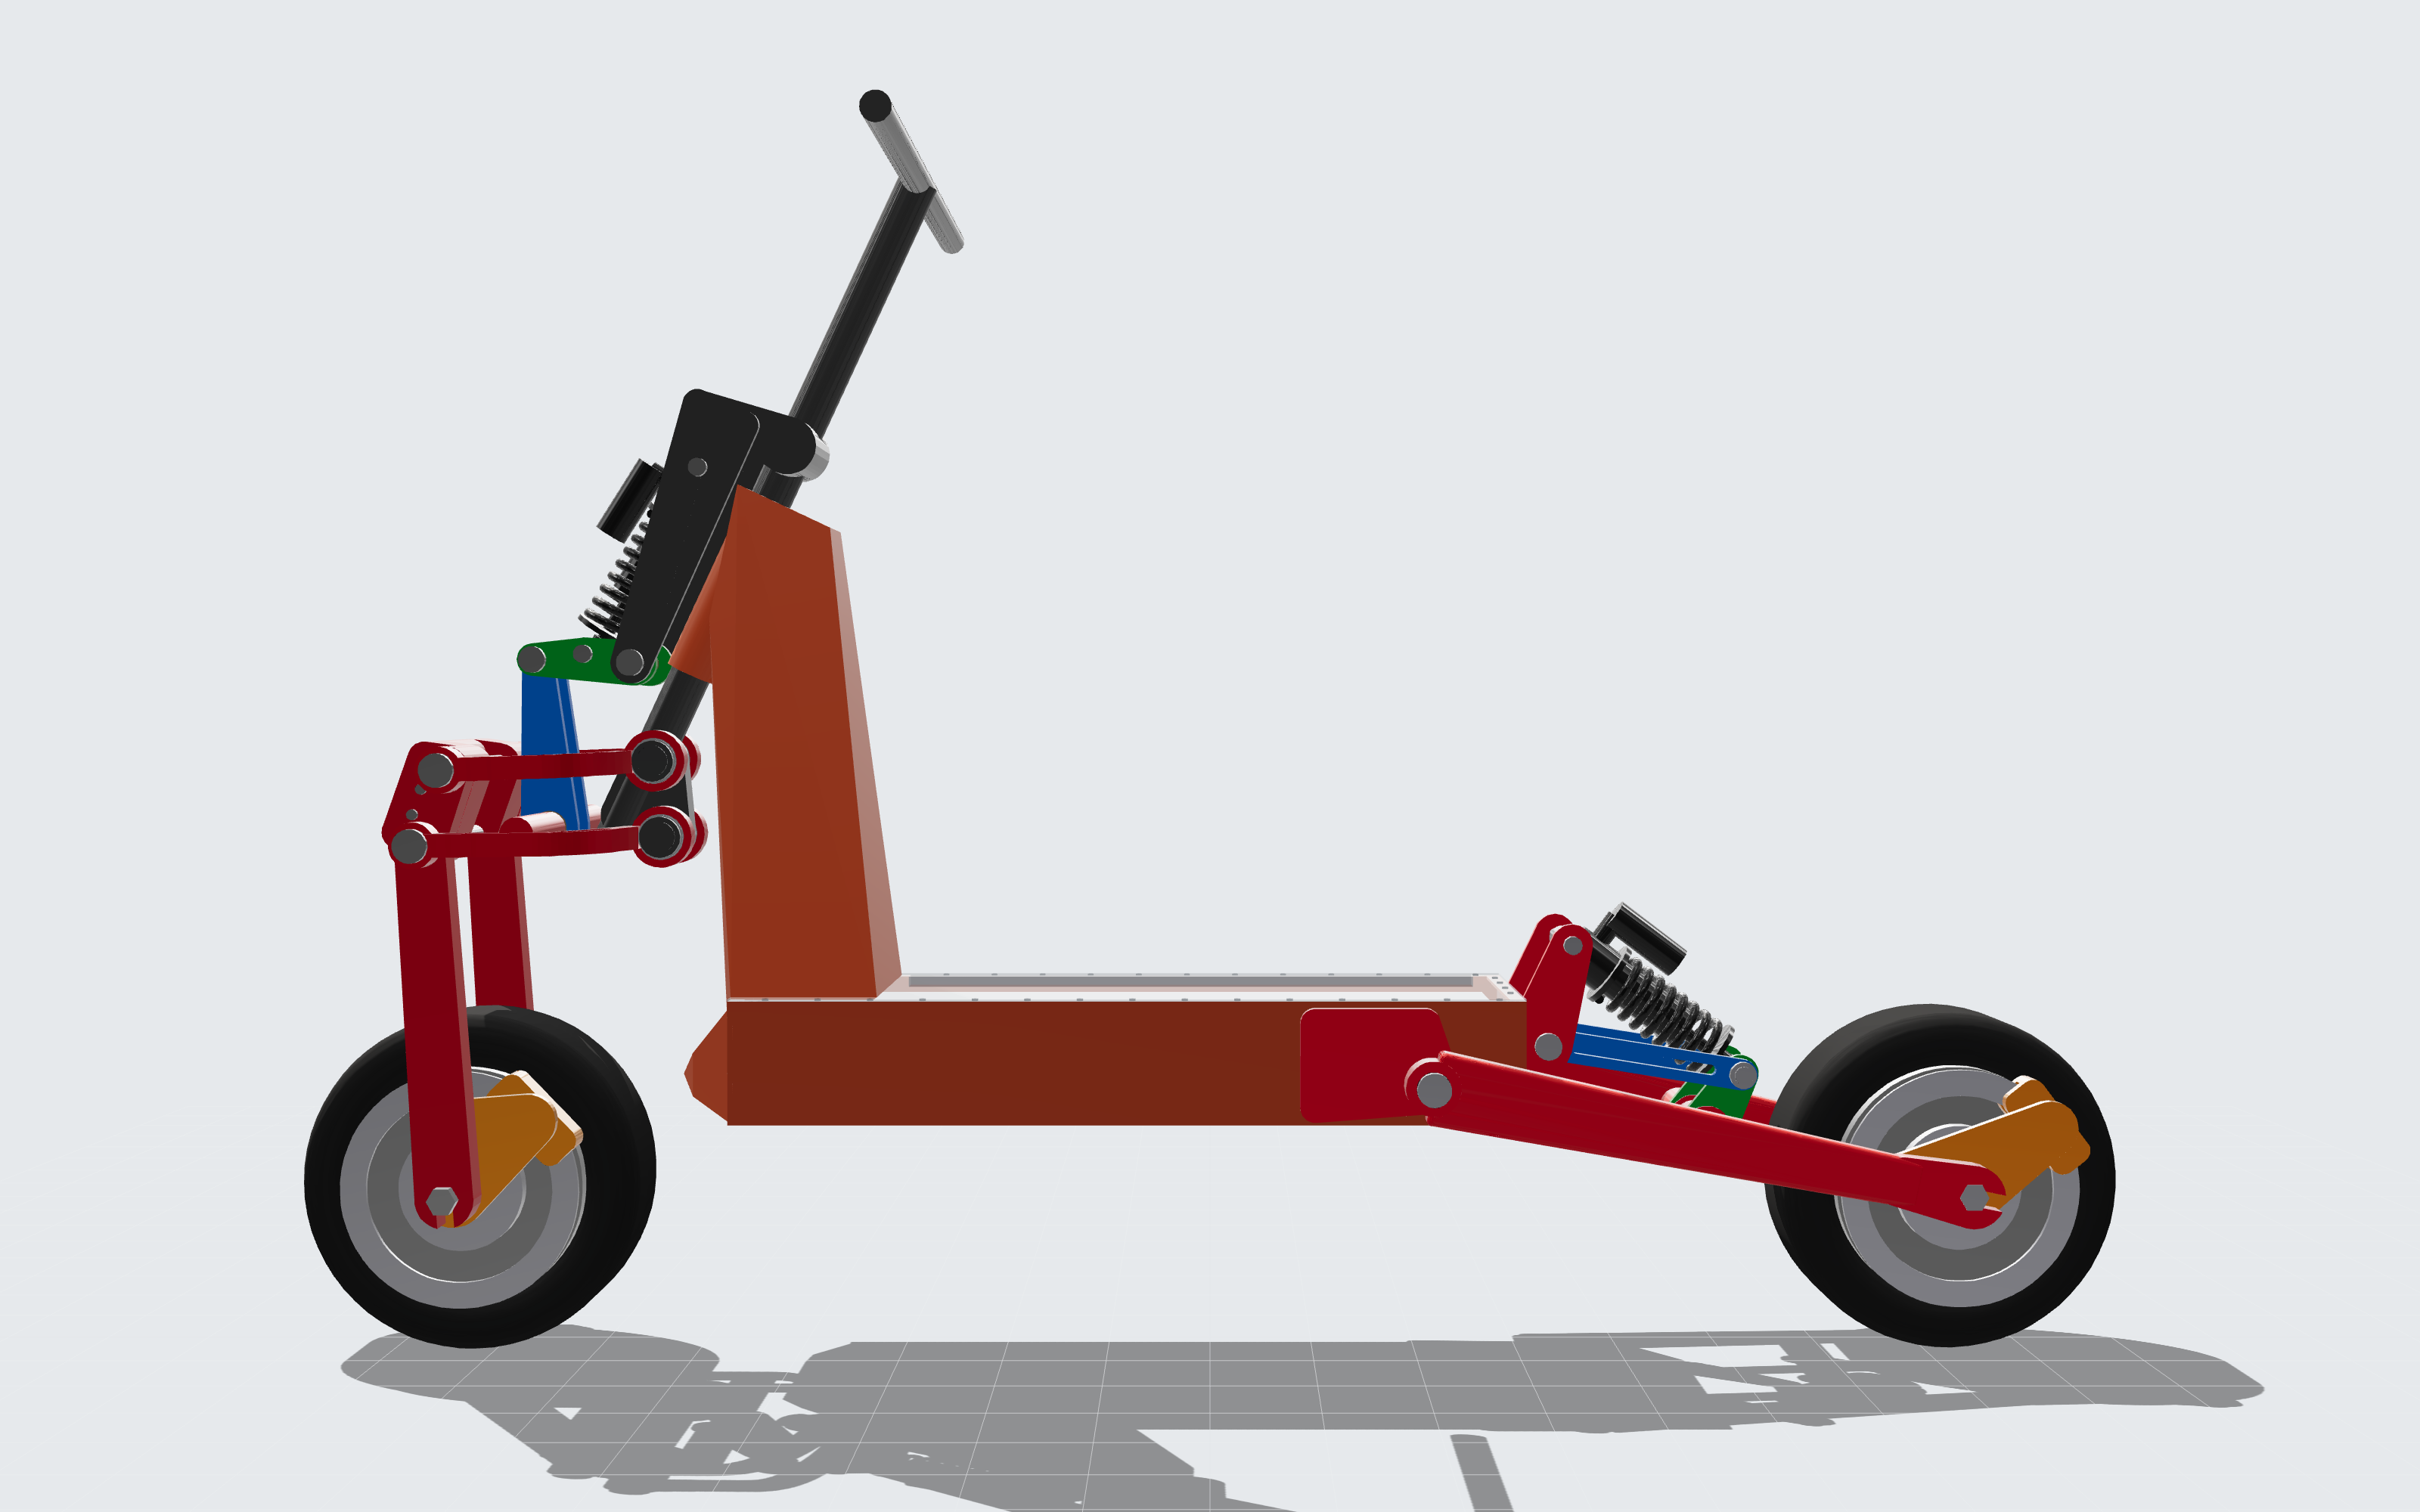
- Suspension — 230 mm of travel at both wheels. A four-bar with a rocker up front, a single-sided swingarm with a rocker at the rear. Shocks — Fox DHX2 230 × 65 mm.
- Drive — two Lonnyo hub motors, 8 kW each, VESC-based controllers.
- Battery — 24S12P of Molicel P60C cells.
The frame's design case is a repeated 2 m drop to flat. Water rating — IPX9K and IPX7 for everything, motors included.
How we design it
Everything that can be calculated is calculated by code, not drawn by hand. Move a pivot — and the curves, the model, the simulator and the pictures all update.
- Kinematics — in Python: an optimizer picks pivot points for targets on wheel path and leverage.
- CAD — in CadQuery: parts are built from the same points. A check runs the full travel and ±40° of steering lock and looks for collisions.
- Simulator — a planar model of the scooter with a rider, in Python: drops, ledges, bumps, braking.
- Test rig — the same model ported to Godot: a 3D replay slowed down to ×0.01, with charts. The rig and the Python reference agree to thousandths of a percent.
That rig is where it all started.
A strange chart
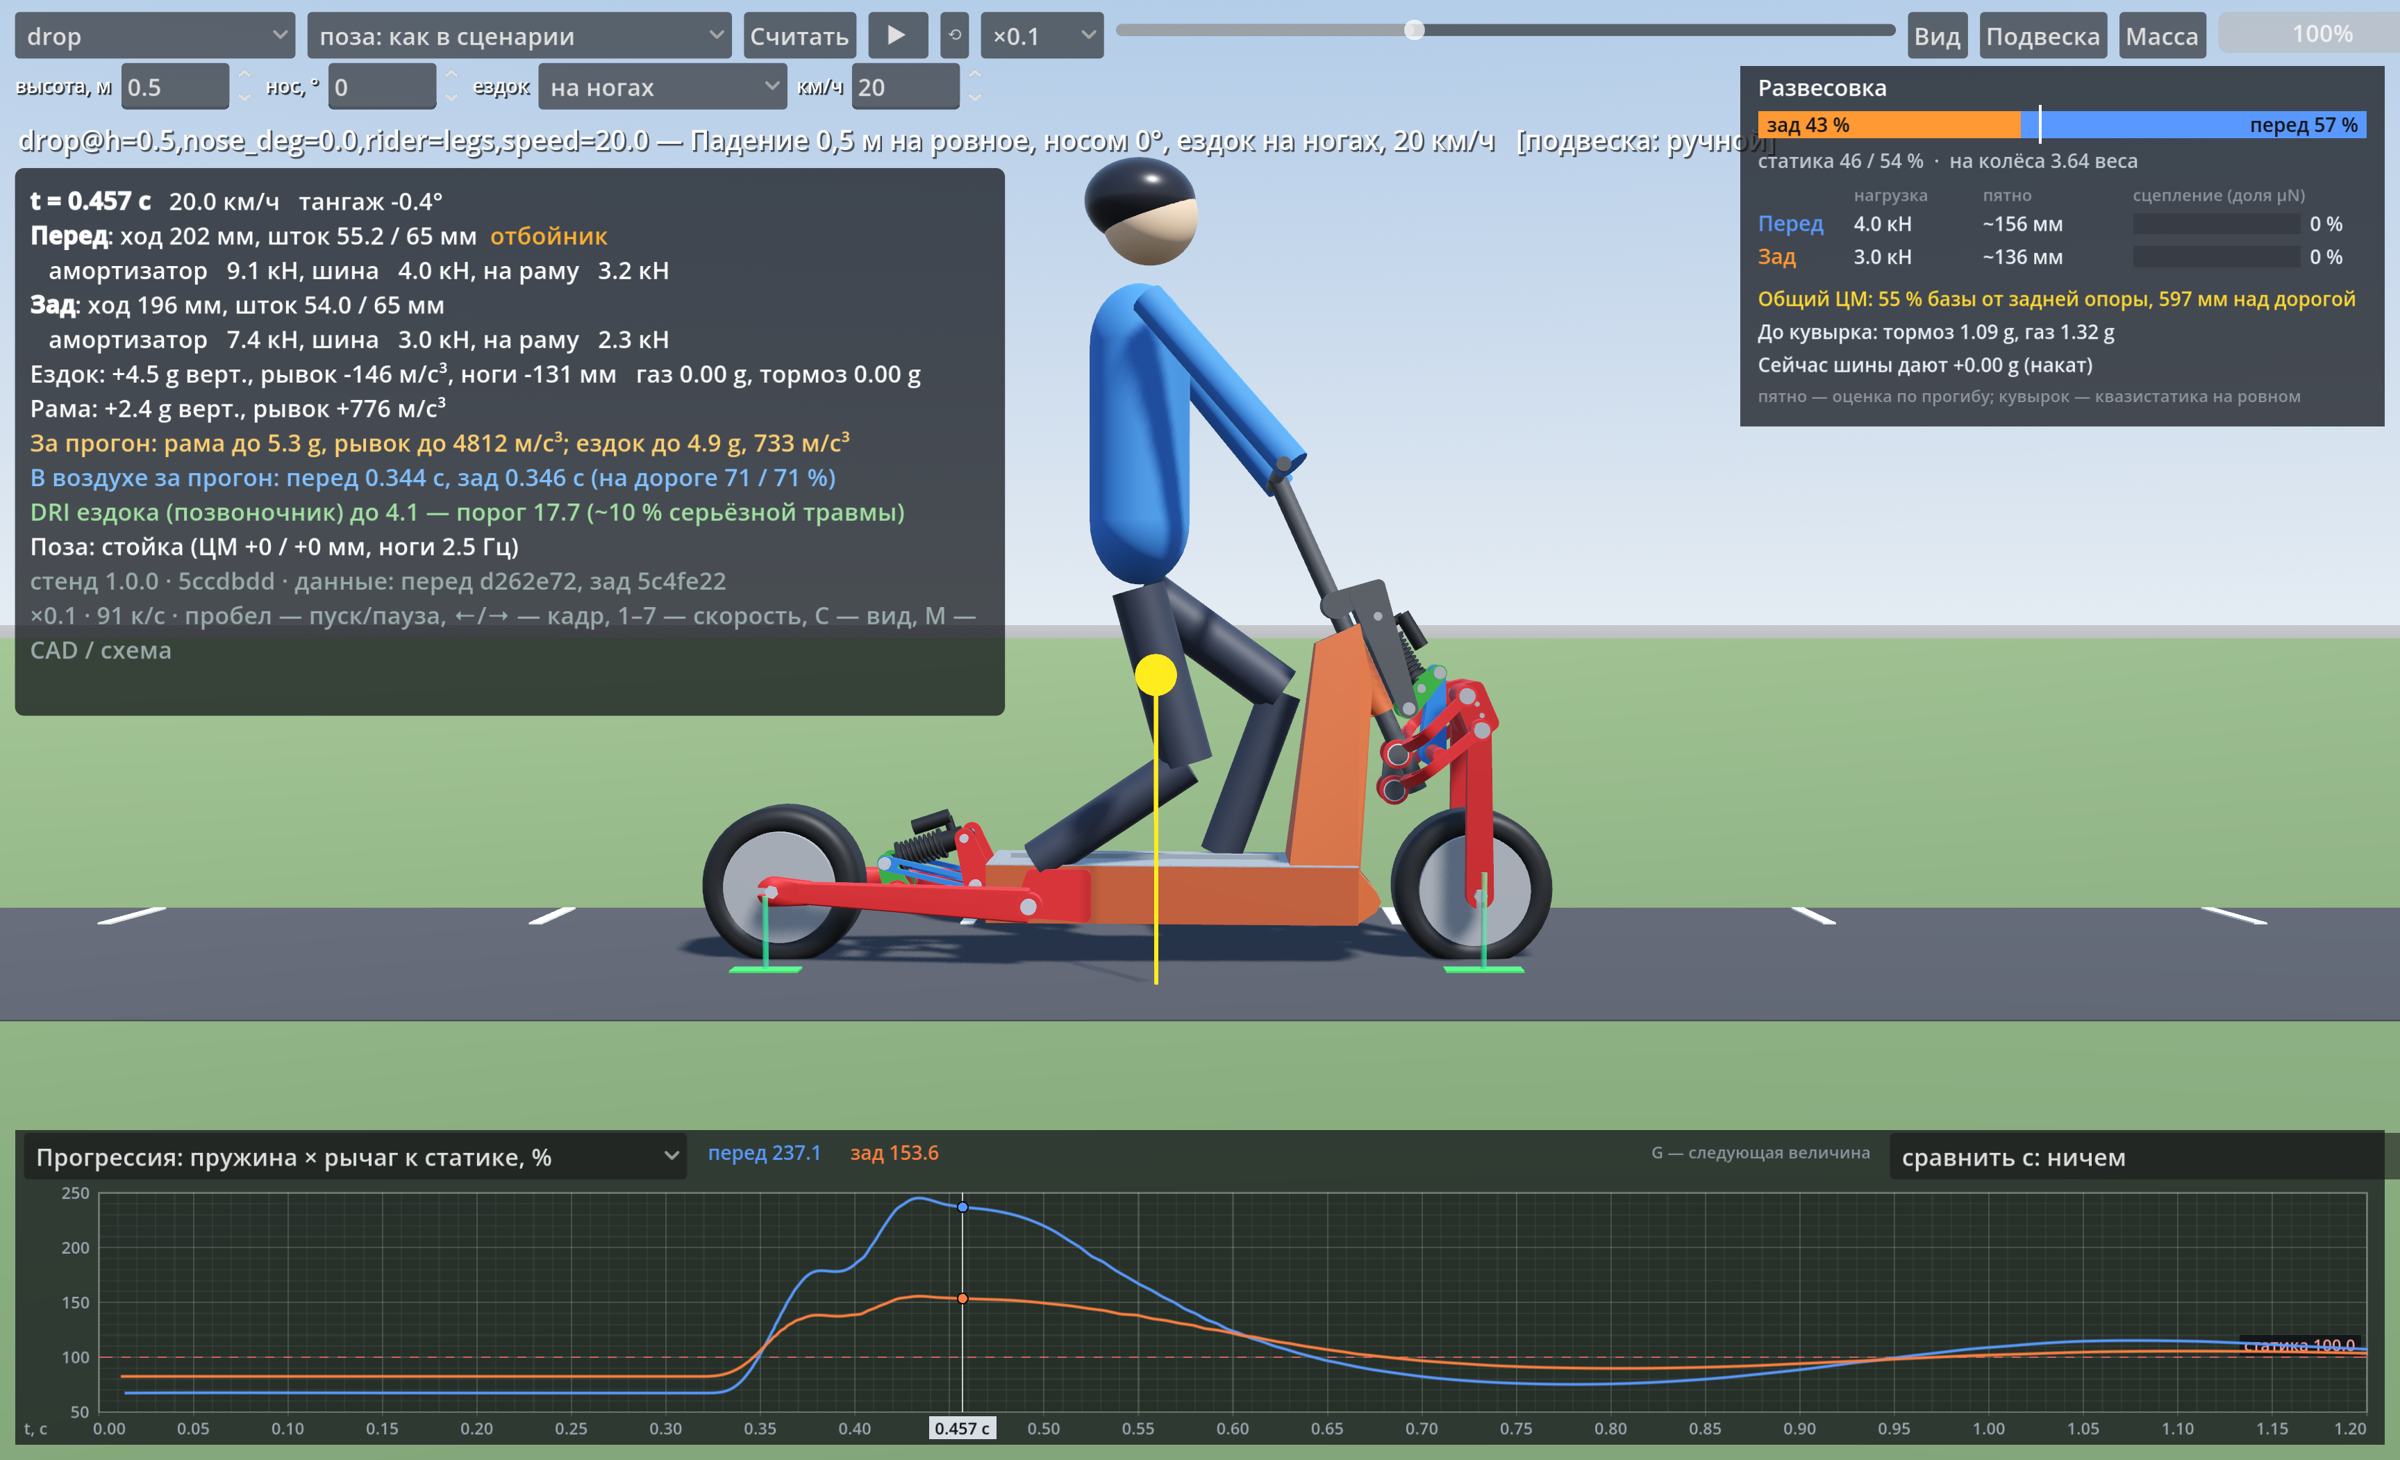
The rig has a "progression" chart: spring rate referred to the wheel, as a percentage of static. It shows how the suspension stiffens as it compresses. We were looking at a 0.5 m drop at 20 km/h. The rear rose smoothly to ~155 %, while the front behaved oddly: up, down, and up again.
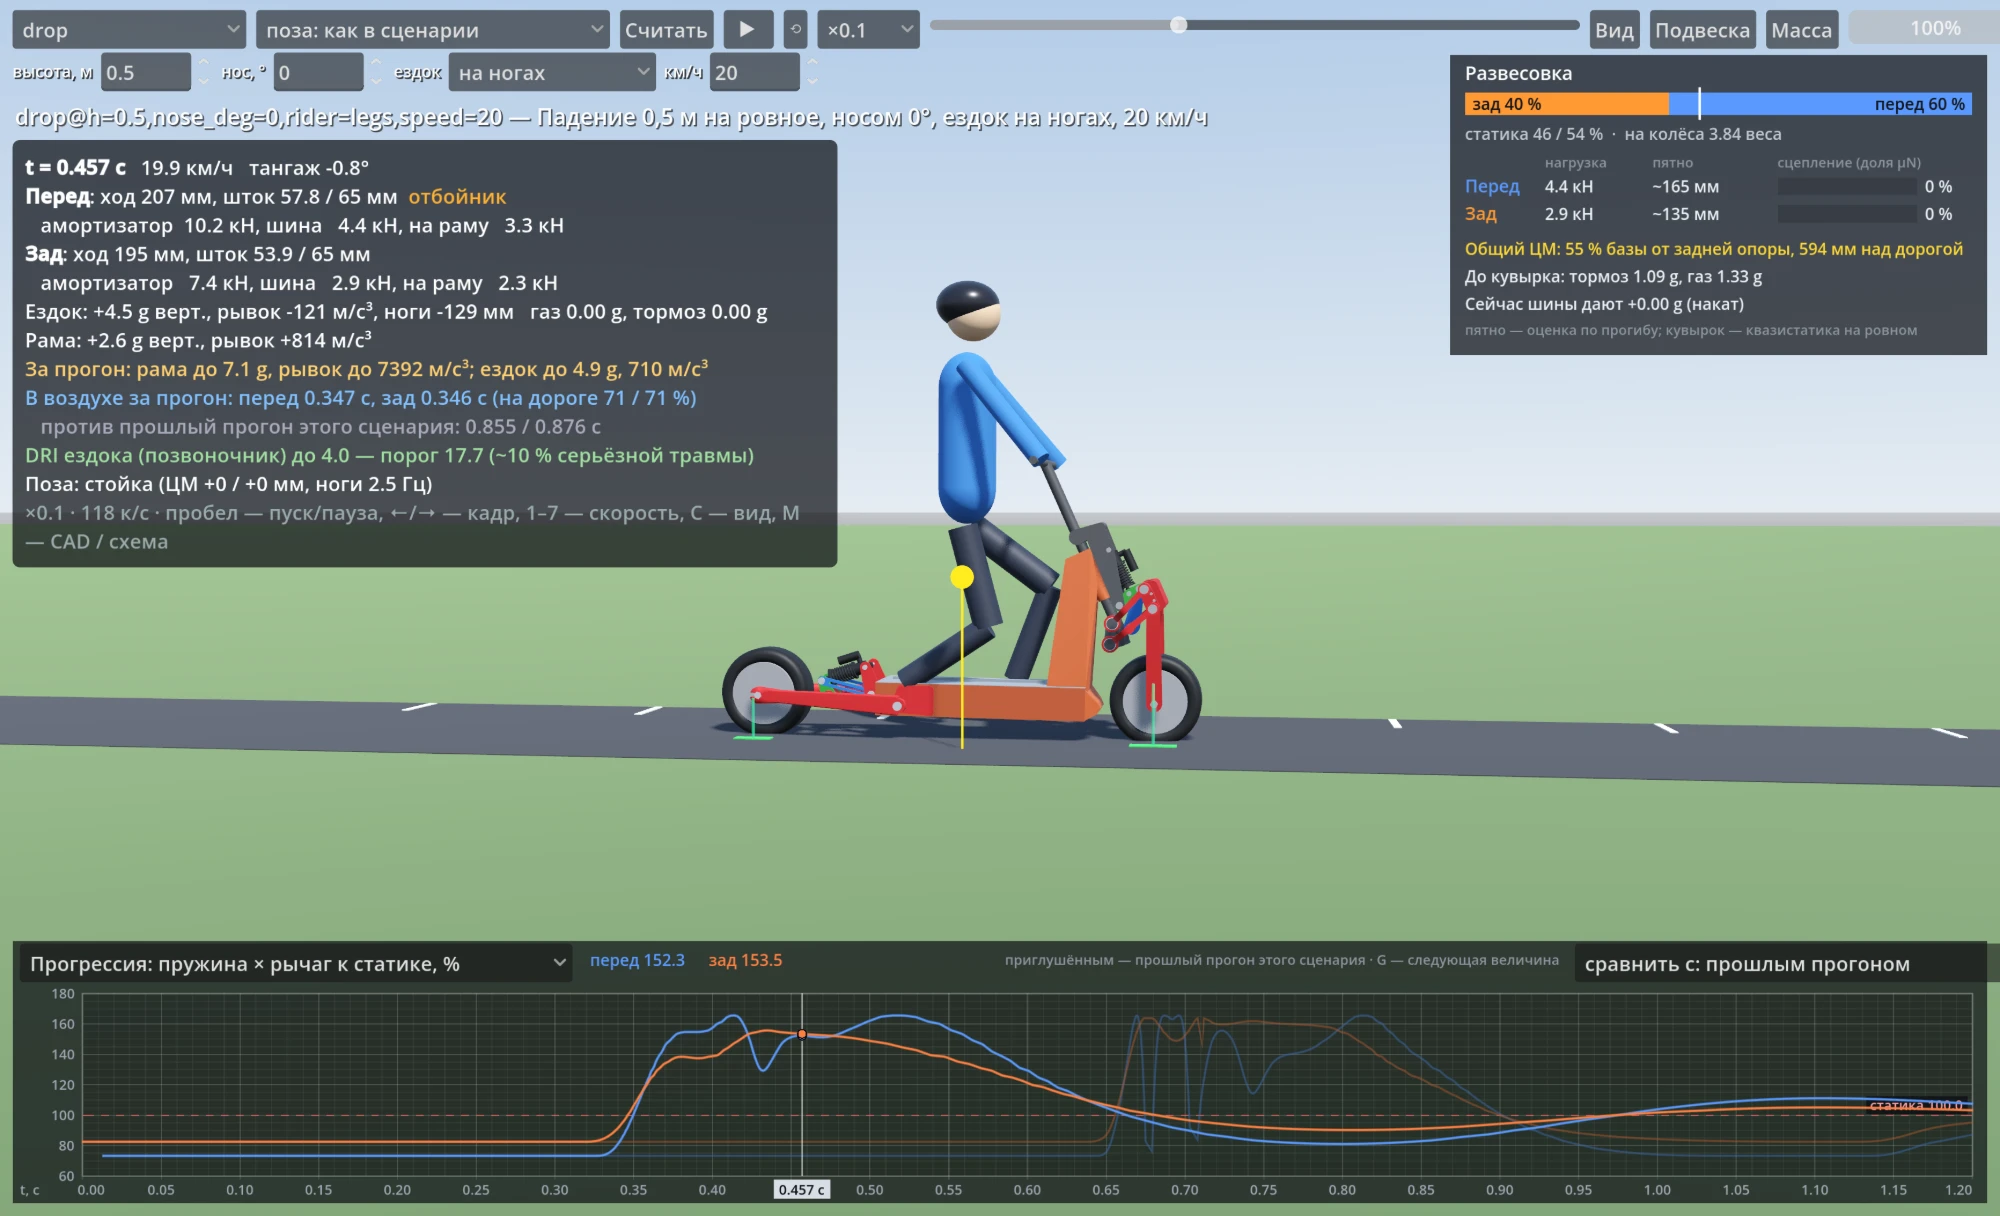
The first thought was a calculation error. The rig computes wheel rate through the second derivative of shock length over travel, and that is easy to spoil numerically.
Kinematics, not arithmetic
We recomputed the same quantity in Python over the full travel — both from the rig's spline and from raw kinematics without a spline. The curves matched, and the dip stayed.
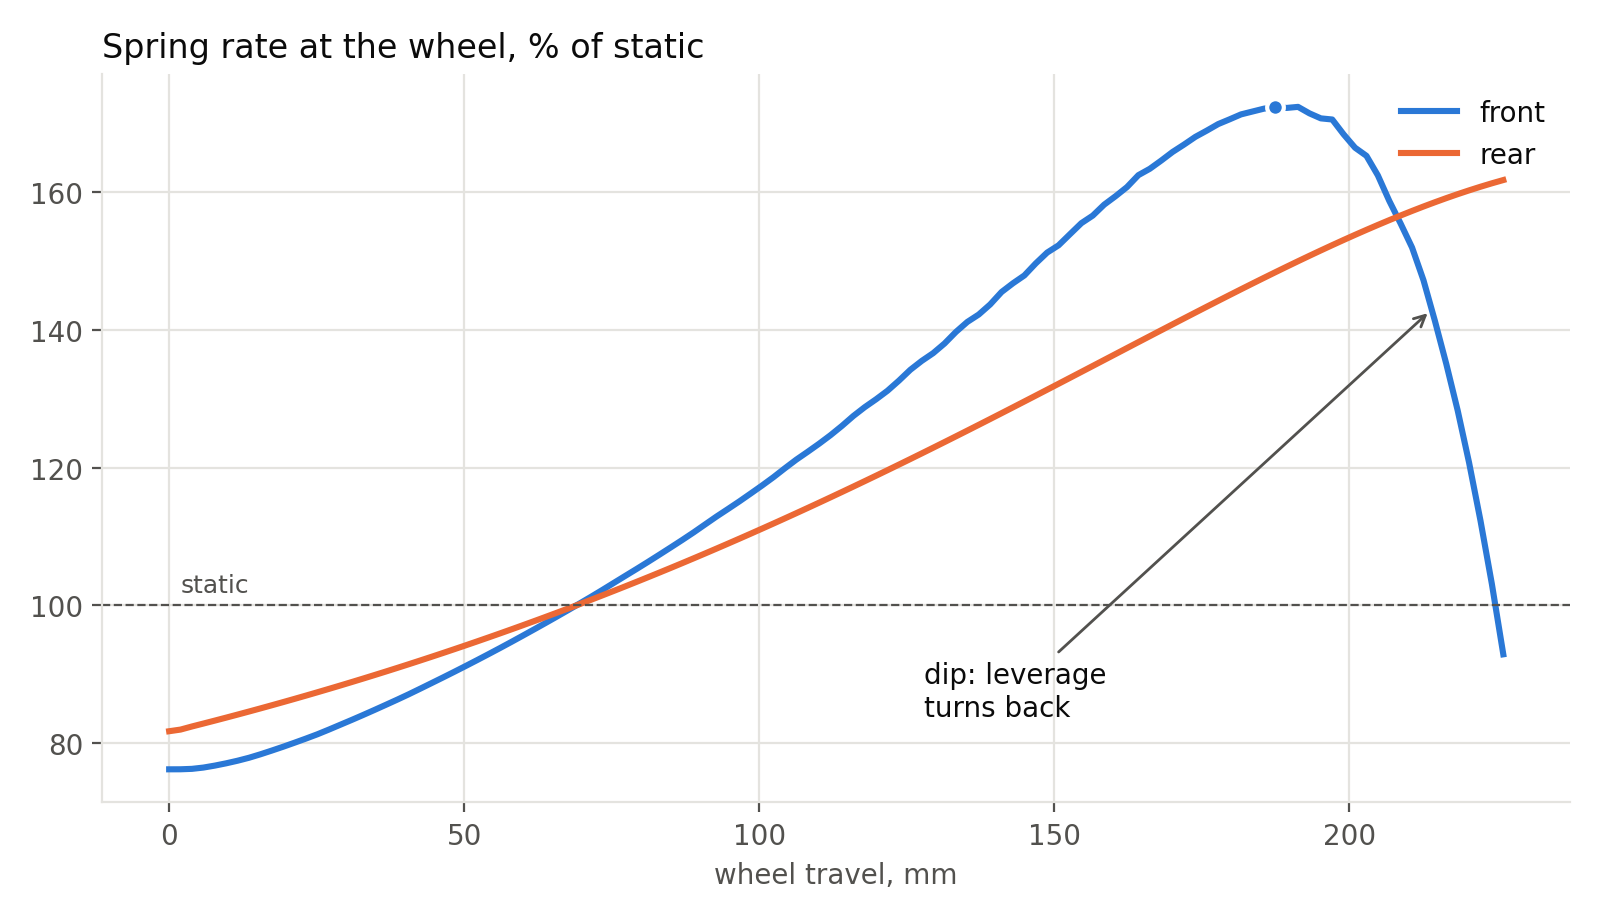
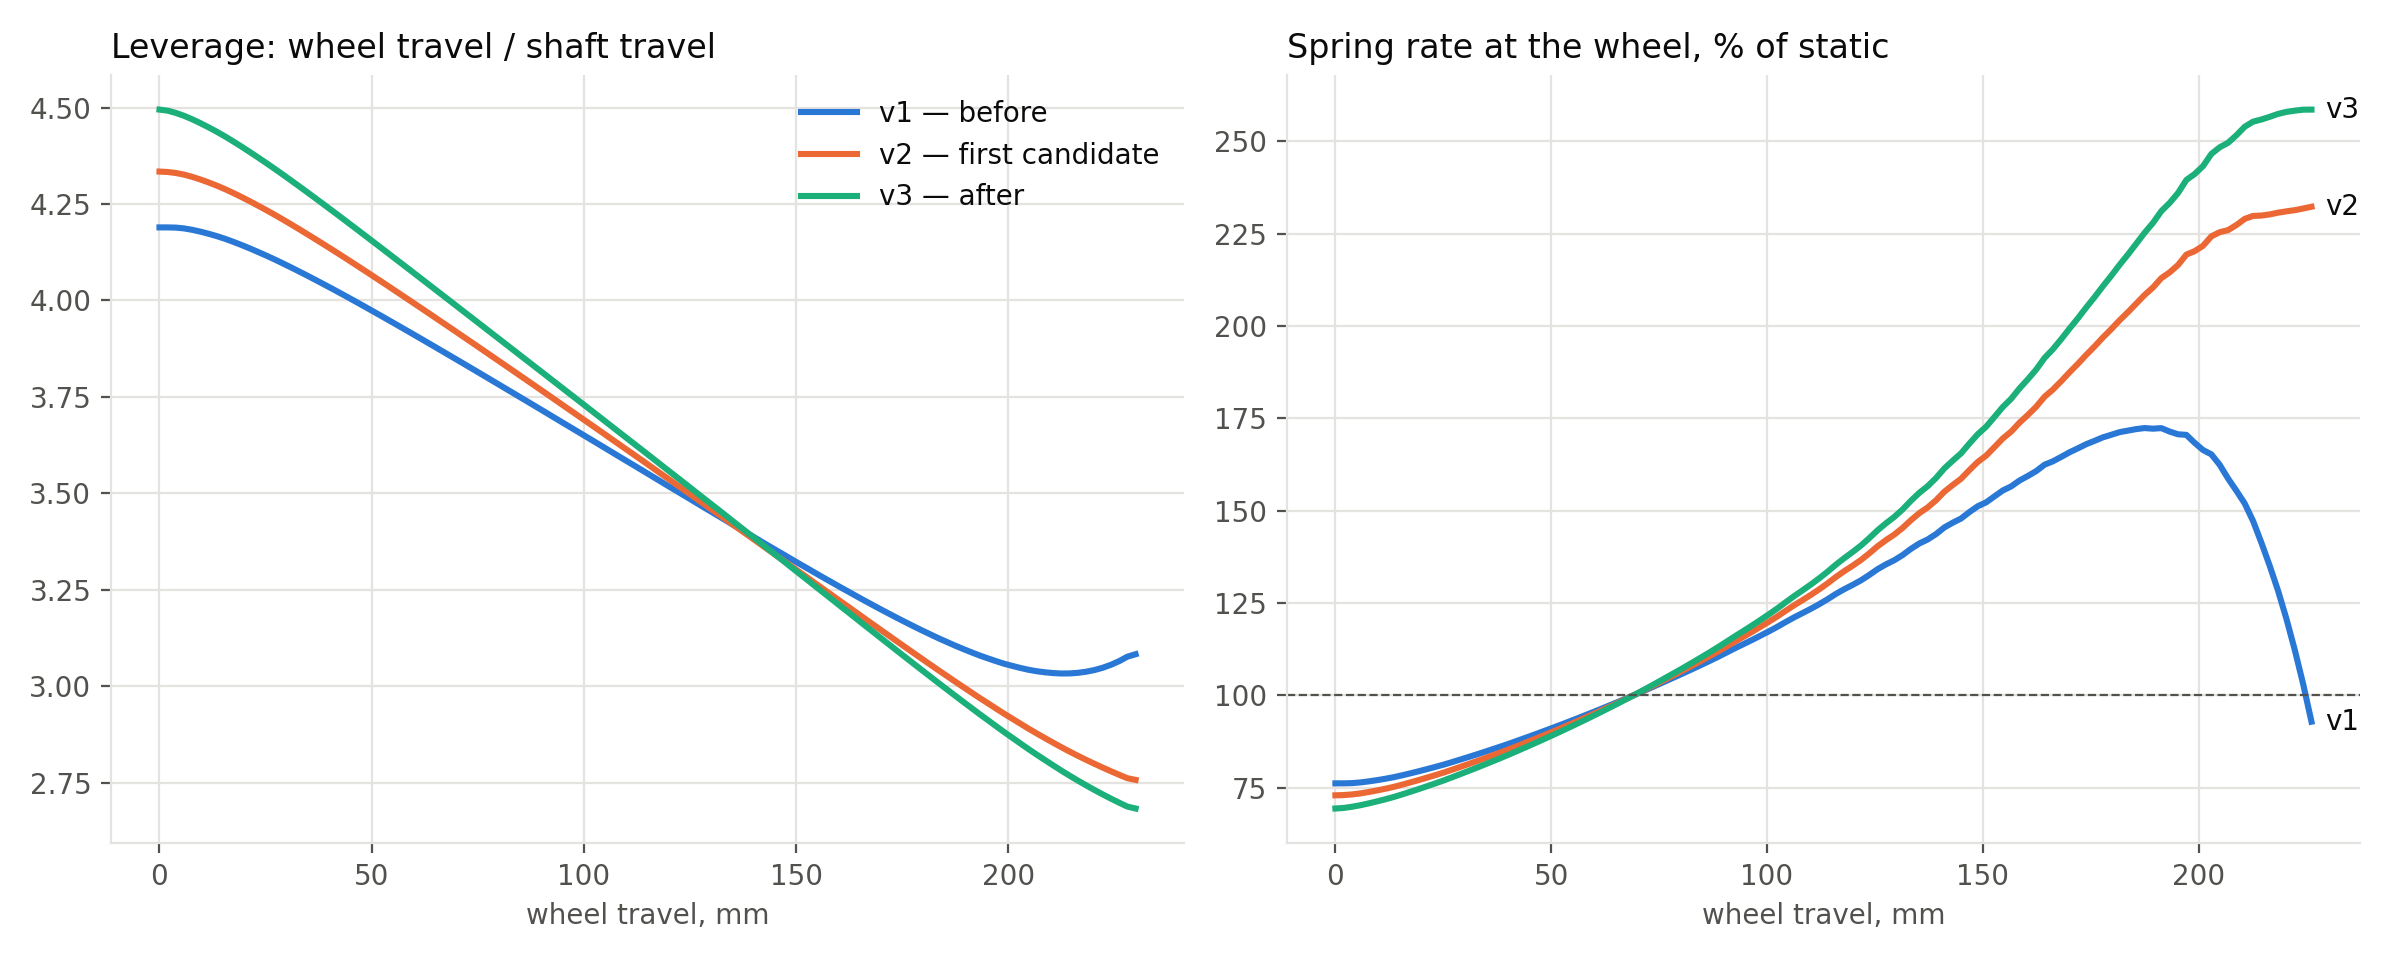
It's the leverage. With the old rocker, the "wheel travel / shaft travel" ratio fell from 4.19 to a minimum of 3.03 at 213 mm and then rose again. Wheel rate is made of two parts: spring rate times leverage squared, plus spring force times the rate of change of leverage. When the leverage turns back, the second part flips sign — and spring force near the end of travel is about 10 kN. That is what pulls the rate down: from 172 % of static at 189 mm to 137 % at 216 mm.
A condition instead of points
We didn't touch the four-bar: wheel path, trail and anti-dive were already tuned. We re-optimized only the rocker — its pivot, arms, the link and the shock's upper eye. To the existing targets we added one condition: wheel rate must not fall anywhere in the travel.
Five attempts
The very first candidate gave a smooth curve. But a curve isn't a part yet, and that's where the collisions started.
Each collision became a new optimizer condition: clearance from the link and rocker plates to the arch, to the fork axles, to the crown housings, to the link arm roots. We checked every condition against CAD first: on the old geometry, the measure had to show contact exactly where CAD sees it.
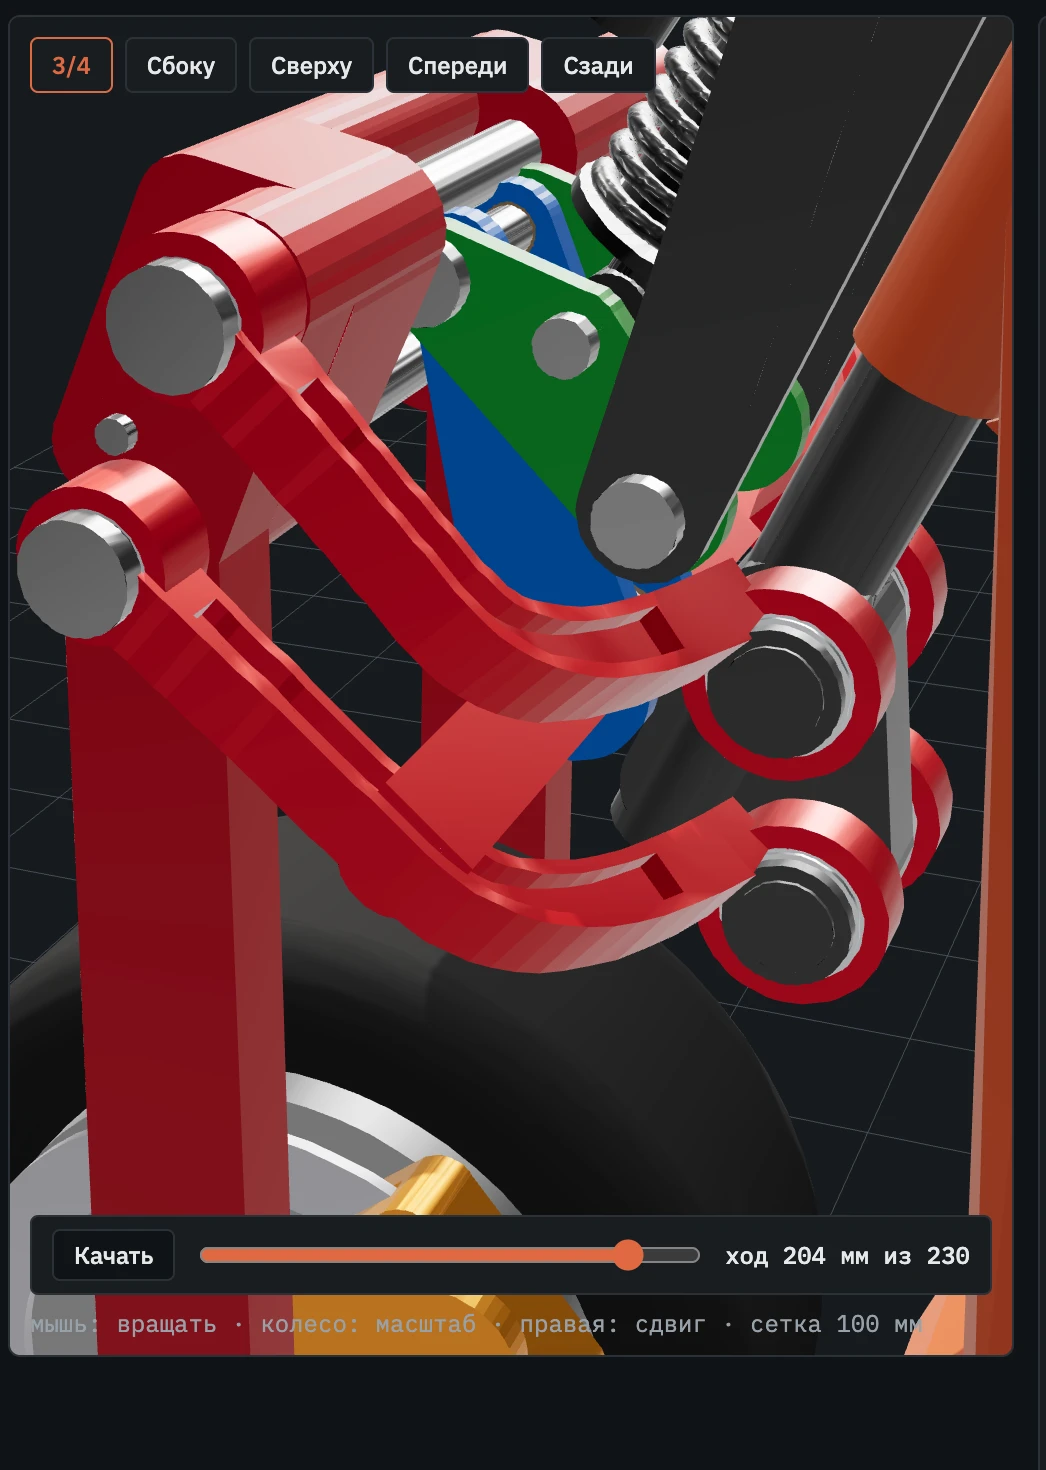
Rocker v3
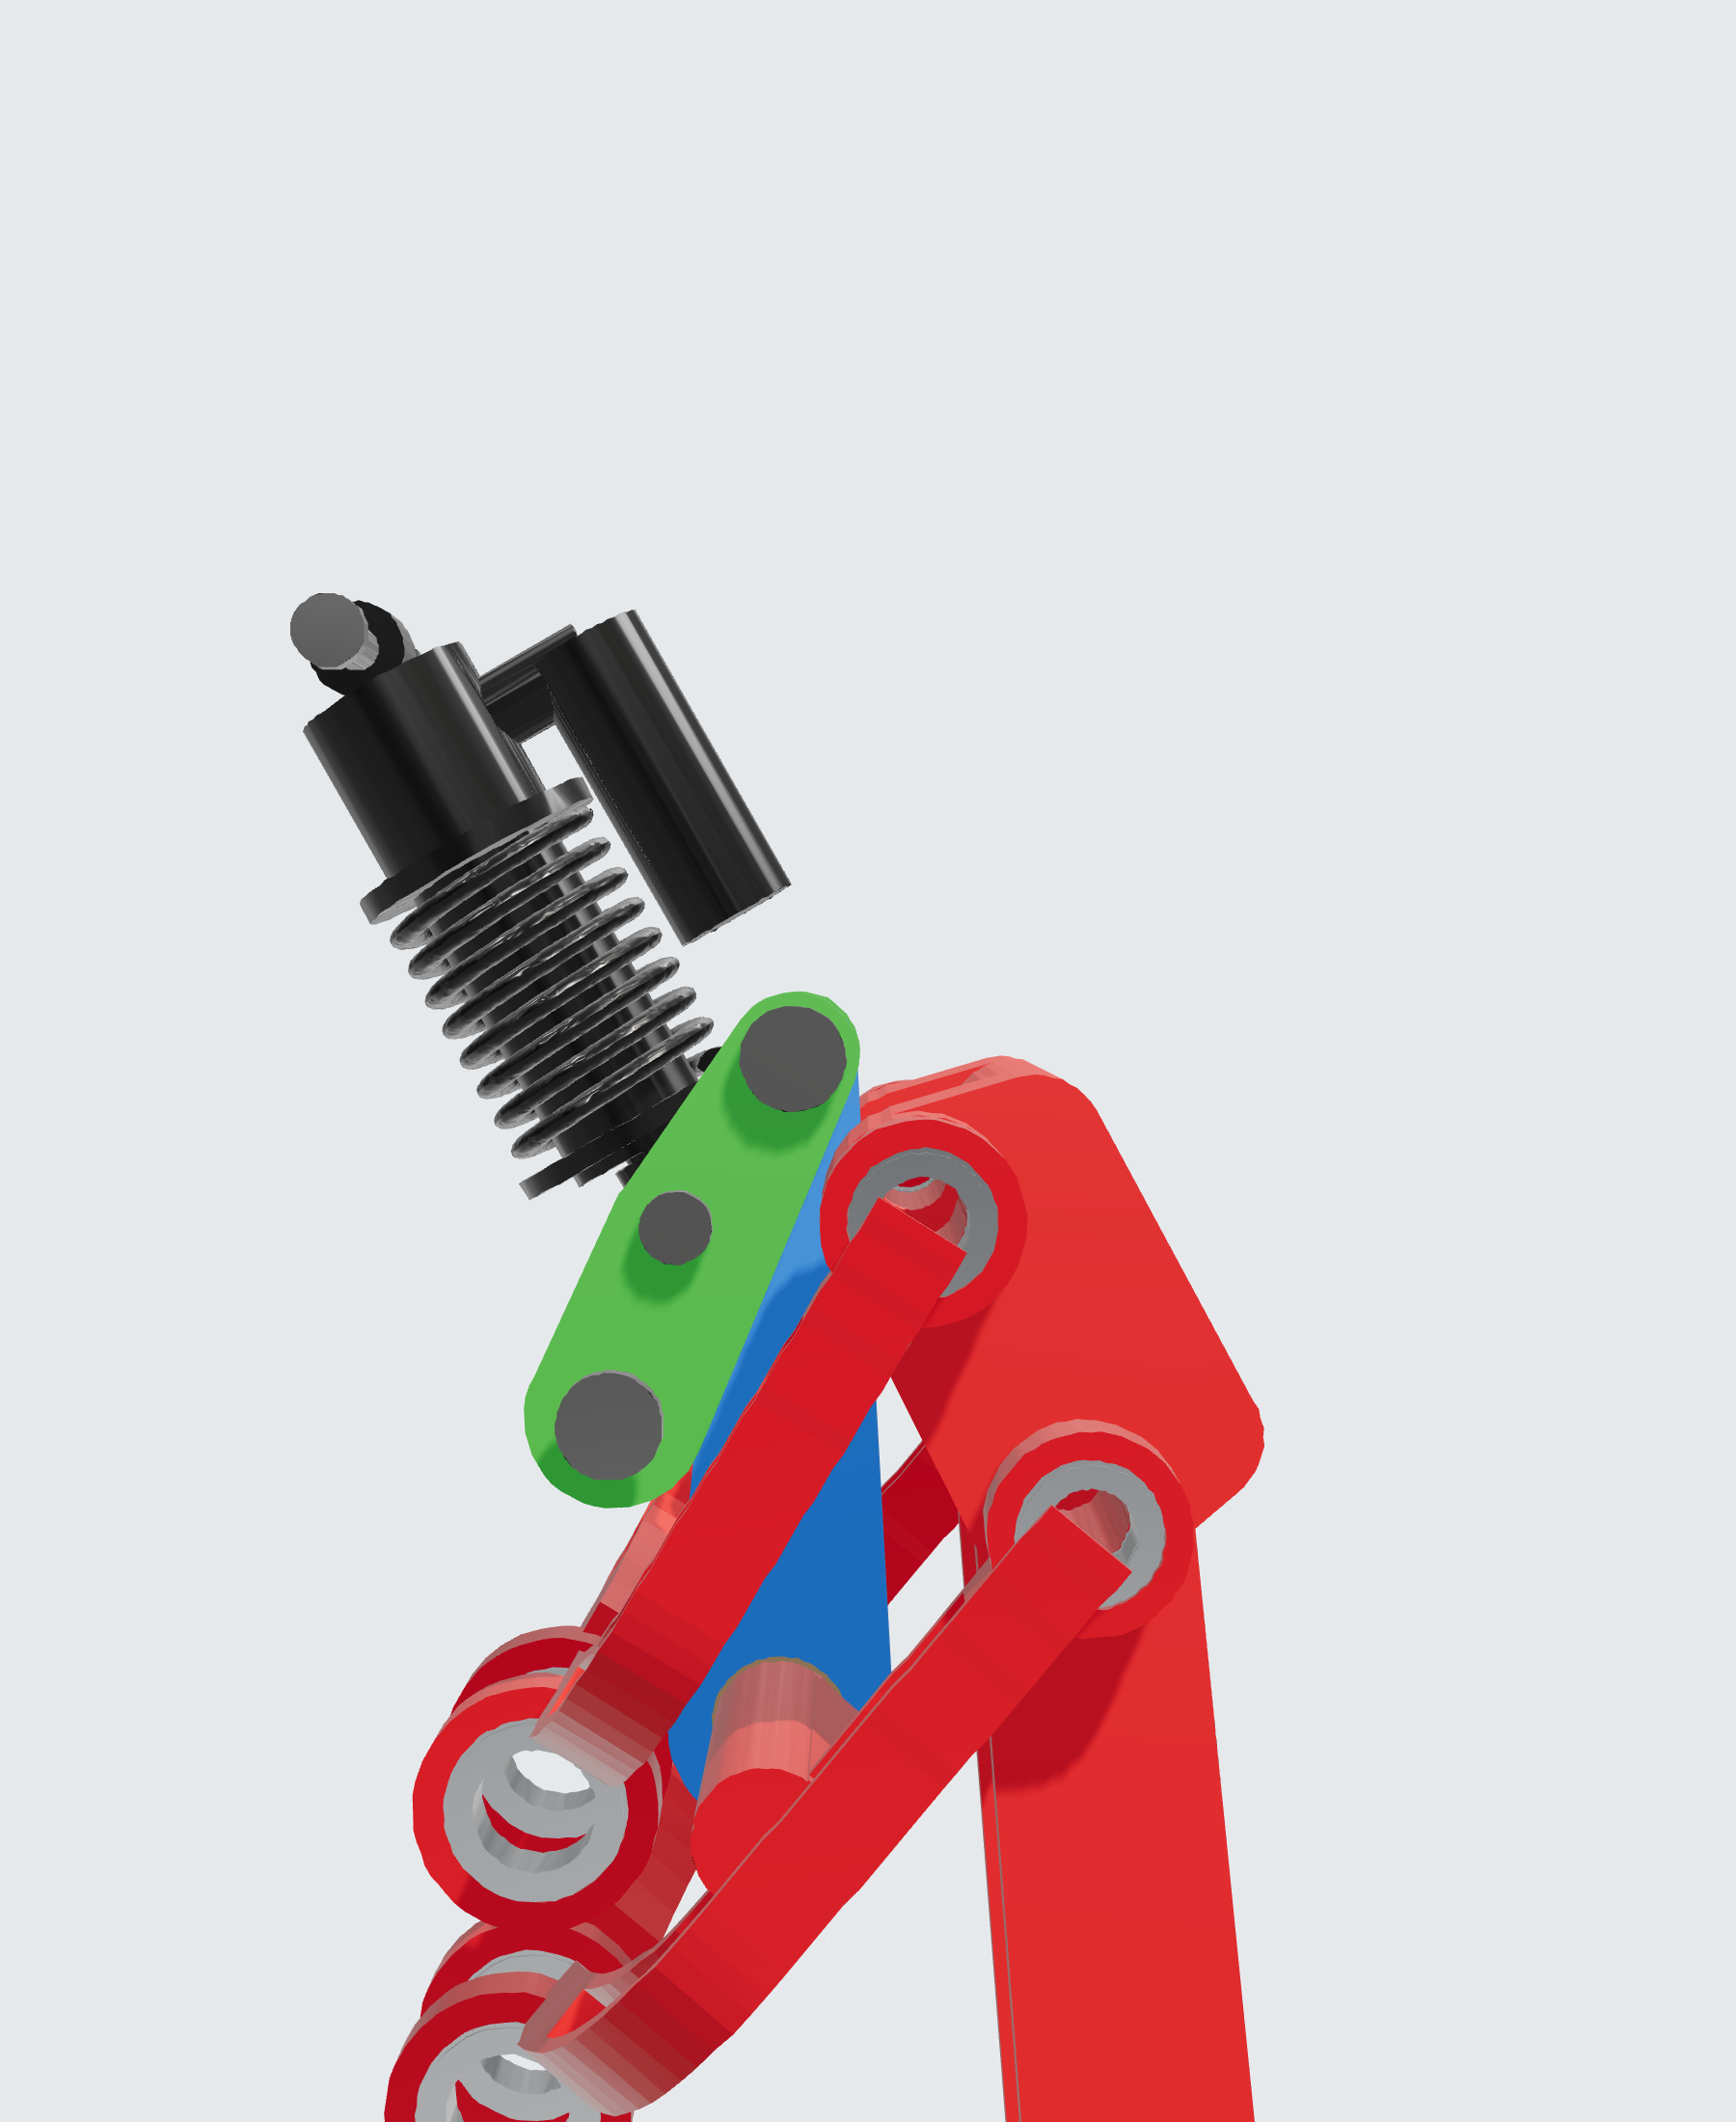
Fifth attempt. Rocker arms of 98 and 49 mm, a 166 mm link, and the rocker turns through 83° over the full travel.
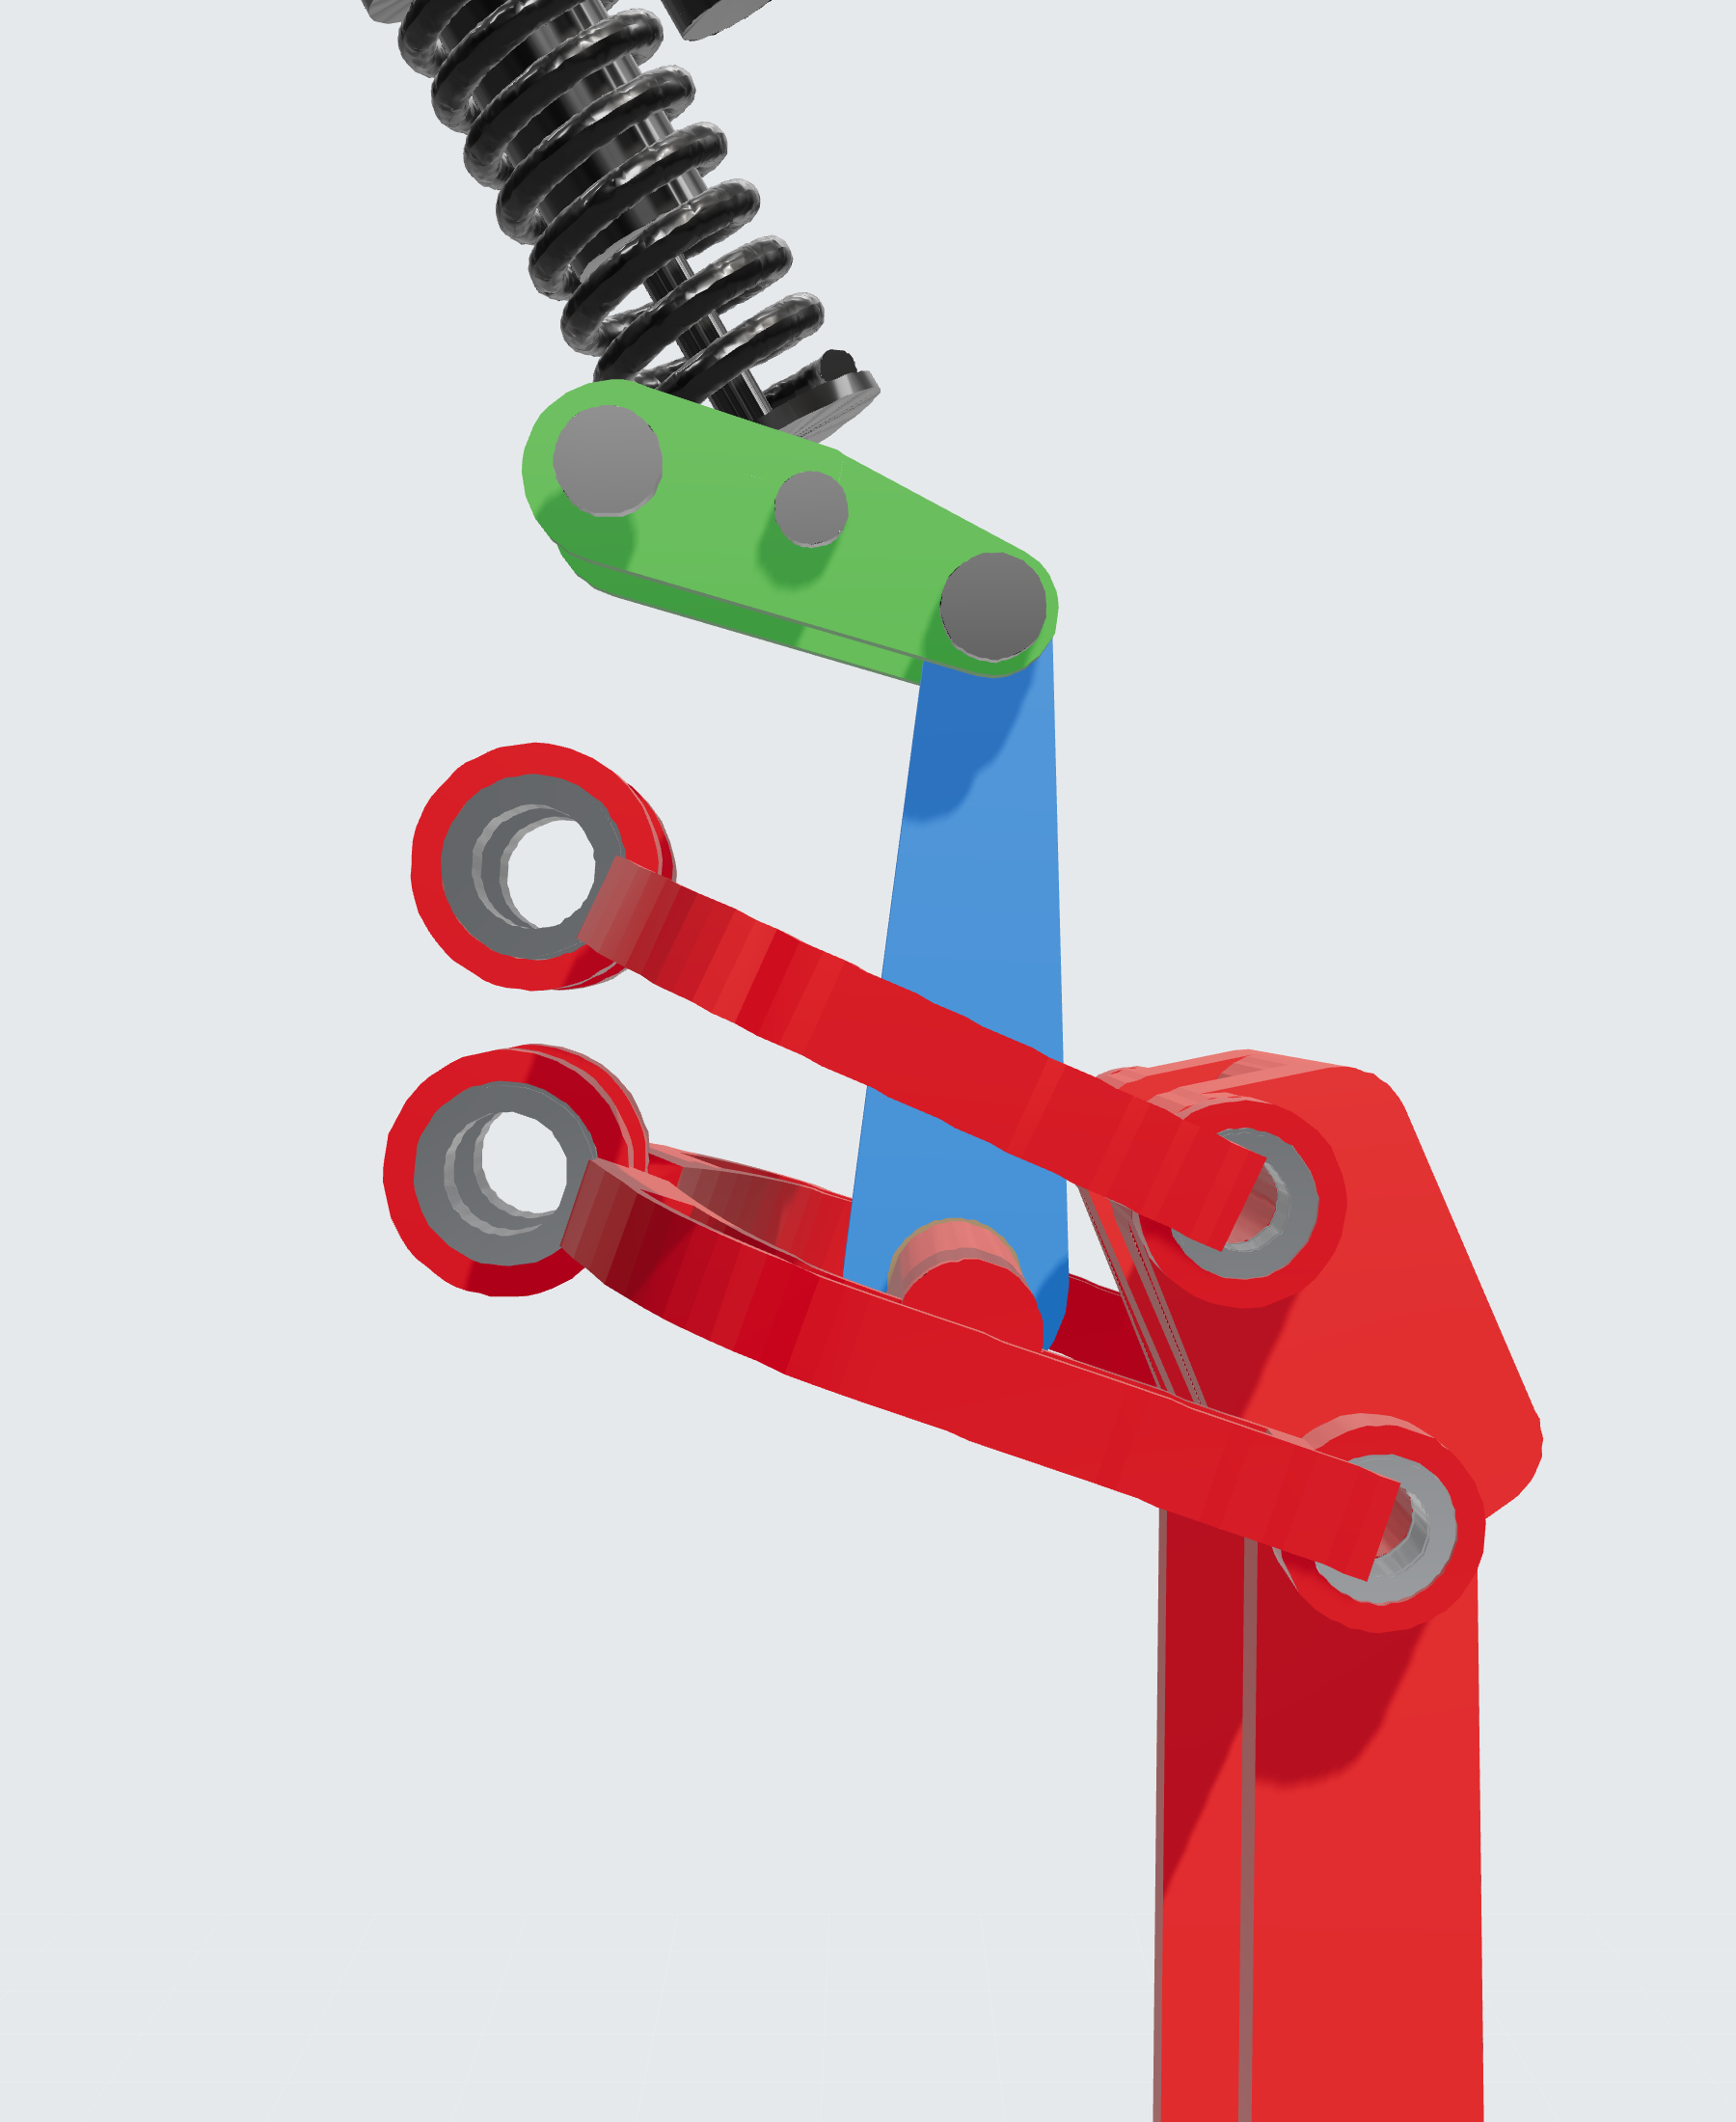
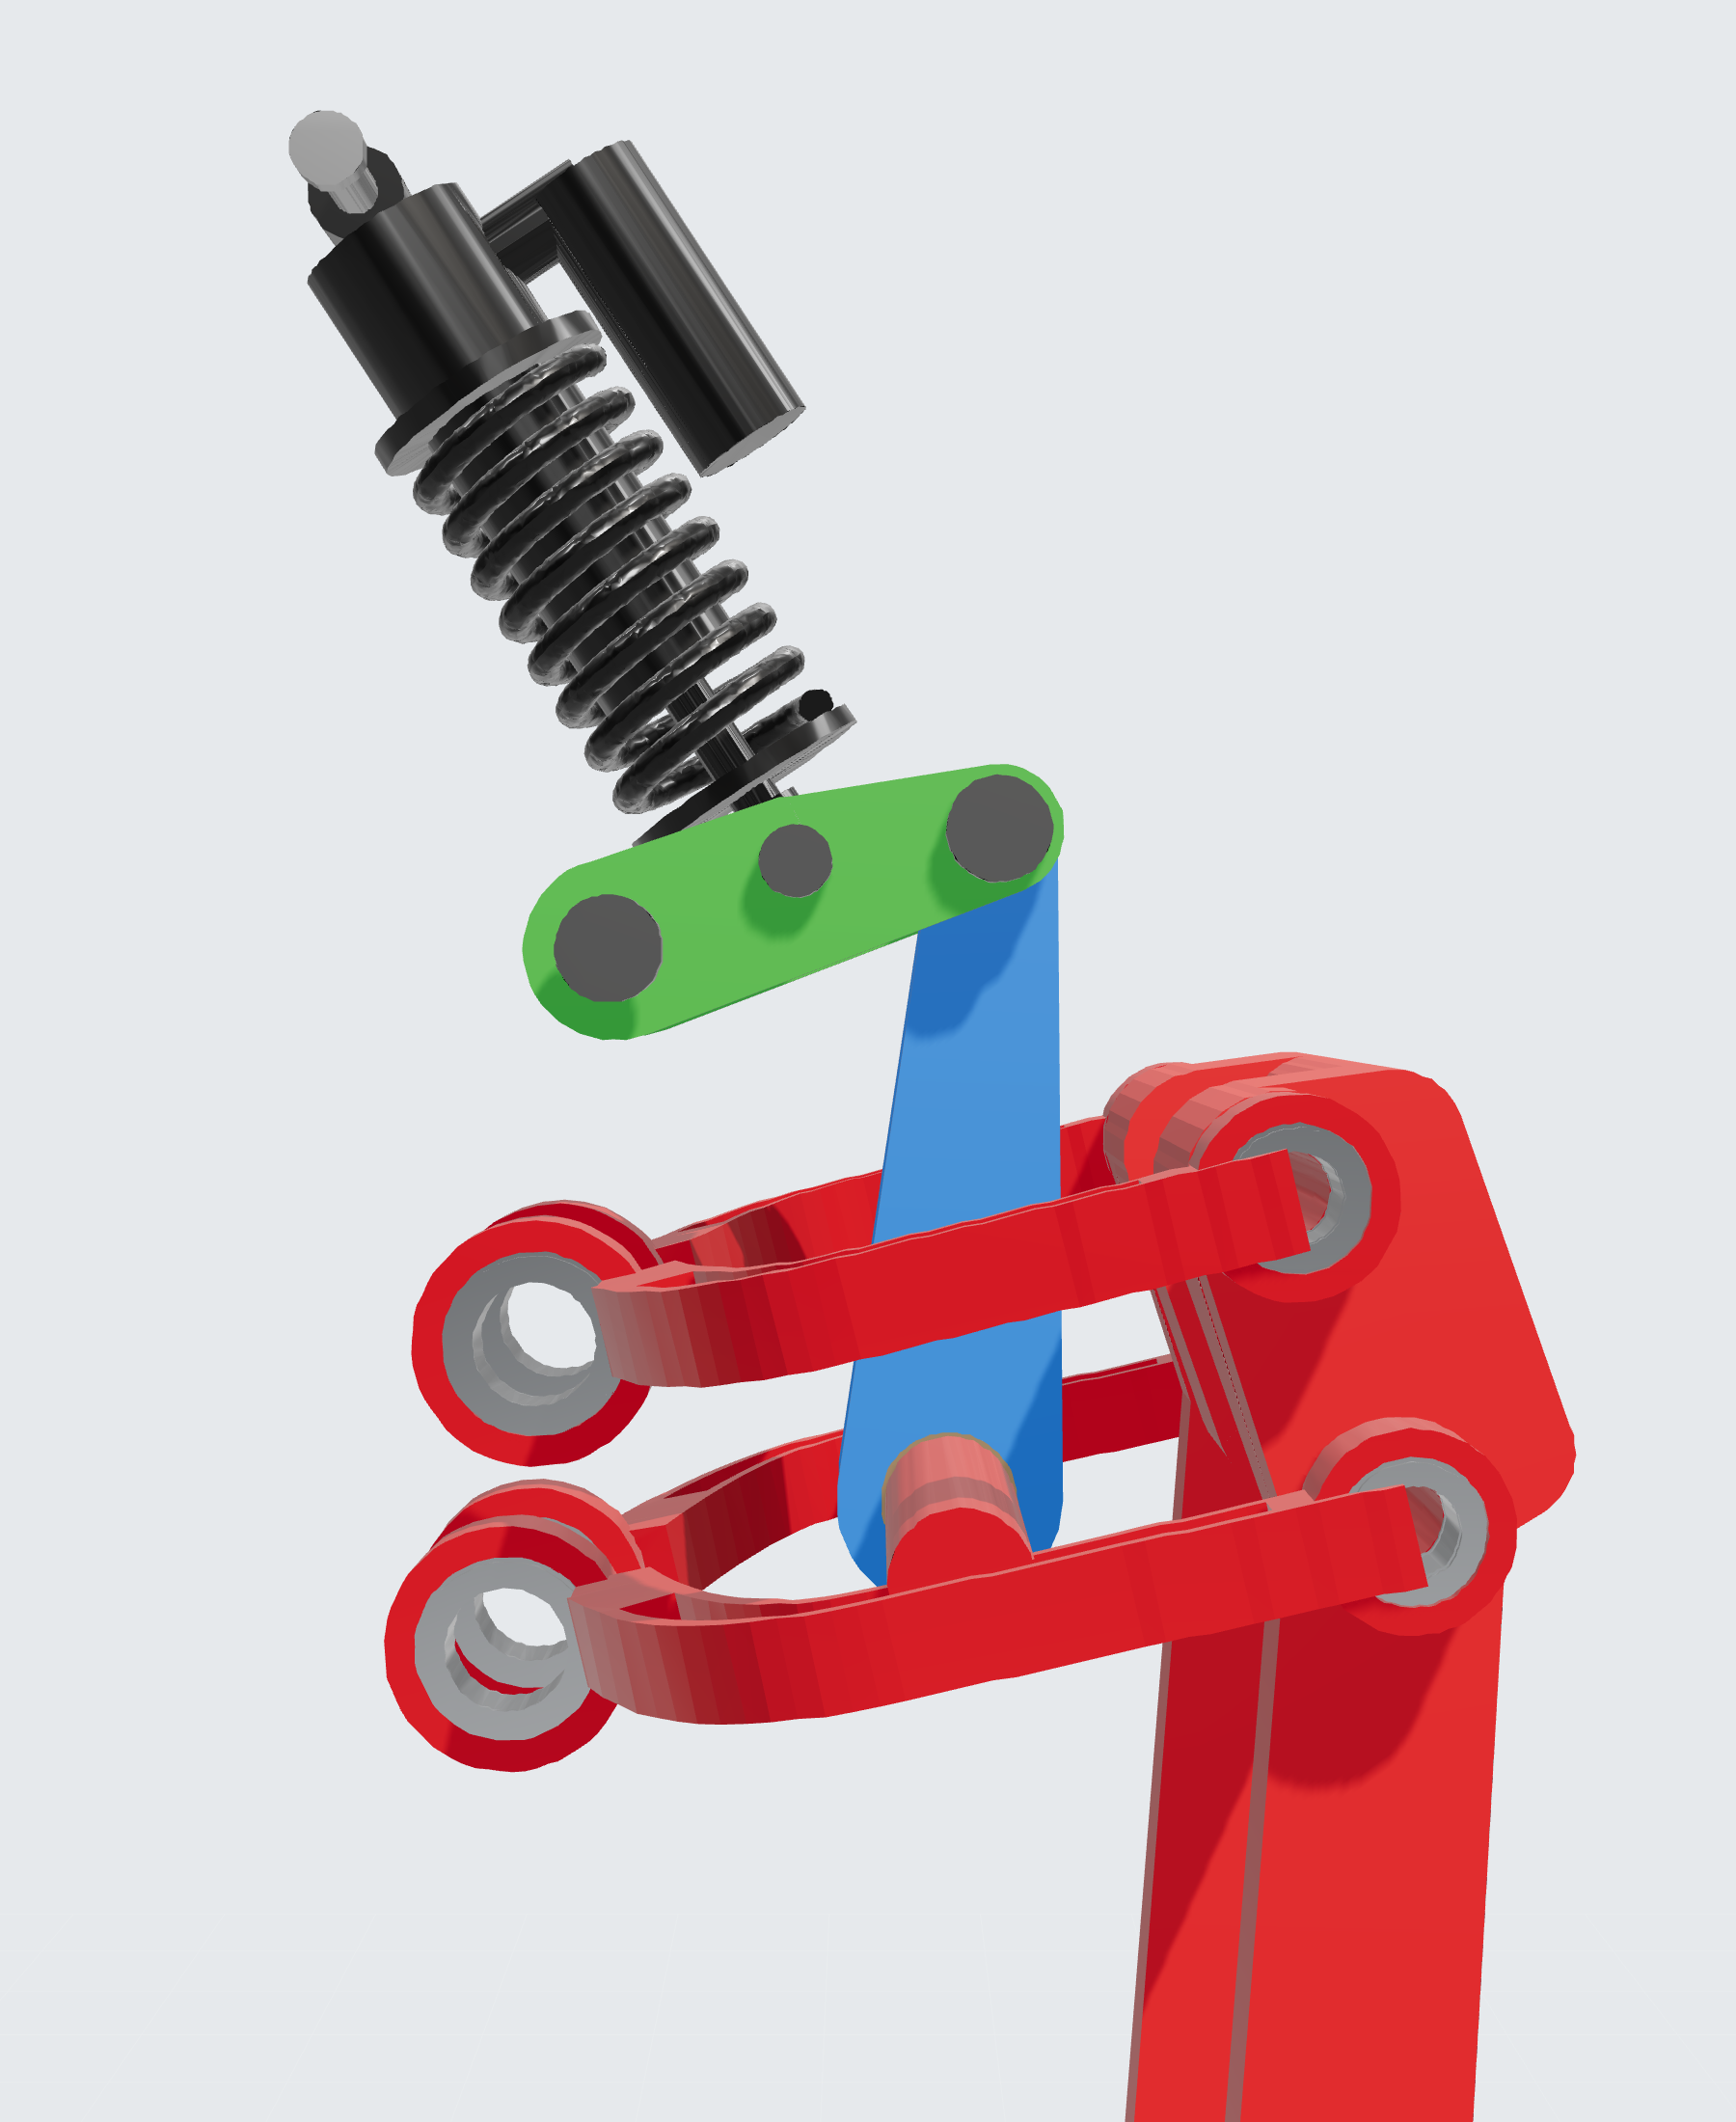
Leverage now falls over the whole travel — from 4.49 to 2.69, 40 % progression instead of the former 26 %. Wheel rate climbs from 69 % of static at the top of the travel to 259 % at the stop.
On the rig the same drop now looks like this: one smooth peak at the front, no dips.
What it gives
We ran every simulator scenario with the old and the new rocker. The spring was chosen so that static sag stays the same.
| Scenario | Shock force | Wheel travel | Bottom-out |
|---|---|---|---|
| 0.5 m drop, 20 km/h | 16.9 → 13.3 kN | 216.7 → 212.7 mm | no |
| 1 m drop | 31.8 → 27.9 kN | 225.8 → 224.1 mm | no |
| 1 m ledge | 62 → 41 kN | 230.3 → 228.7 mm | yes → no |
| 2 m drop to flat | 173 → 156 kN | 235.8 → 234.2 mm | still |
| Bumps, waves, potholes, braking | ≤ 4 %difference | ≤ 1 mmdifference | no |
On medium hits the shock force drops by 12–34 %, and the 1 m ledge no longer bottoms out. Small stuff is unchanged. The 2 m drop still bottoms out — that's a job for the damper, not the geometry.
Front and rear as a pair
Front and rear are built differently: a four-bar with a rocker up front, a swingarm with a rocker at the rear. Yet on a 1 m drop their travel almost mirrors each other: 224.1 mm peak at the front, 223.2 mm at the rear, and over the hit the curves differ by 8 mm on average.
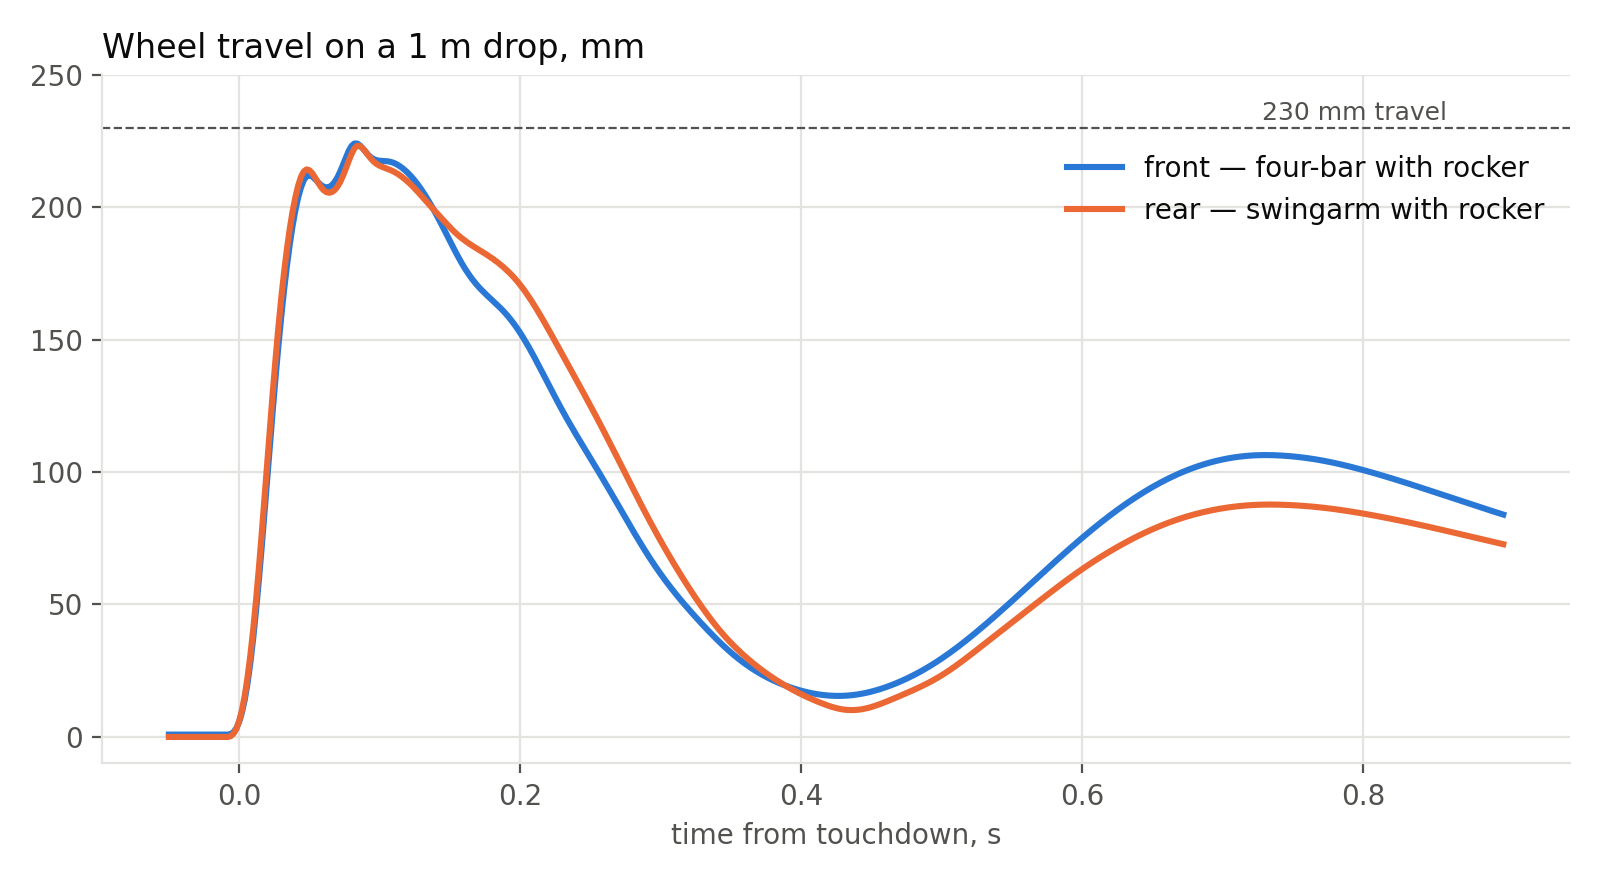
This isn't luck, and it isn't v3's doing. We tuned both ends to the same average leverage, around 3.6, and the same sag, so the old rocker behaved as a pair too. What matters is that v3 kept the pair intact, even though the front now stiffens more than the rear towards the stop.
What's left
- Calculate forces in the link and rocker pivots over the full travel, and bushing margins — especially at the end of travel.
- Check a 1175 lb/in spring for coil fit: length for the DHX2, travel to coil bind, inner diameter.
- Raise the rear progression: right now the front stiffens almost twice as much towards the stop.
- All of this is a model. Measurements will come when we build the front suspension.